Interpreting data from torch.autograd.profiler.profile

I’ve been massaging the data that the profiler outputs so that all of the calls to a particular function are summed together, so my output looks like so:


mul : CPU time 170430.96 calls 844
addmm : CPU time 171562.23 calls 70
mm : CPU time 377847.61 calls 839
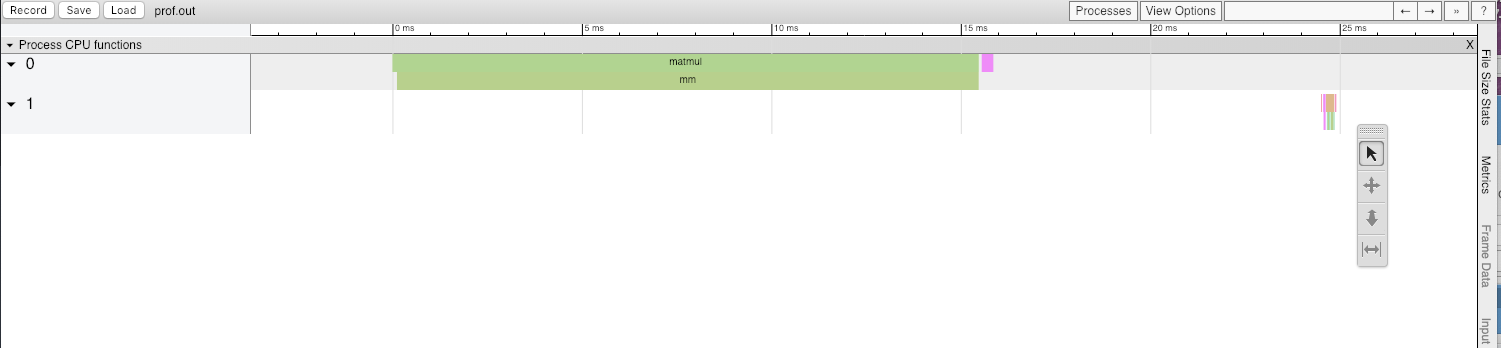
matmul : CPU time 379620.04 calls 839

Now, what I’m wondering is mm and matmul have exactly the same number of calls and and CPU time is very close as well - I’m wondering if matmul is actually calling mm here? Also at the end I sum all of the CPU times together to get a total CPU time for all the calls in the profile - is that correct? (if matmul is actually calling mm then it would not be correct).

Are there any options to the profiler to get this kind of data about total calls?

matmul calls mm so the time it takes for mm is included in the time it takes for matmul. I’m curious if exporting it as a chrome trace will show the hierarchy; I haven’t tried it out myself.

I tried exporting a chrome trace and while I see some kind of trace, I don’t see any labels.

Zoom in maybe?


This is what I see (code used to generate it below)

import torch

x = torch.randn((1, 1), requires_grad=True)
y = torch.randn((1, 1), requires_grad=True)

with torch.autograd.profiler.profile() as prof:
    z = x.matmul(y)
    z.sum().backward()

prof.export_chrome_trace("prof.out")
2 Likes

ah, ok, had to figure out how to make it zoom. Finally figured that you push that down arrow looking icon and then left click and move the mouse up - that UI is very non-intuitive.

1 Like