Hello All,
I would like to get some feedbacks on interpreting the following dice curve.
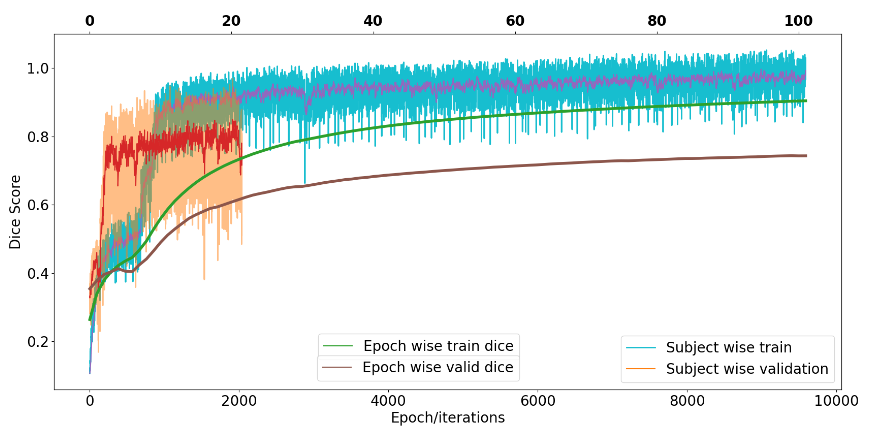
Trained for 100 epochs, 100-20 train-validation split between the number of subjects. (the lower X-axis is 100 subjects per epoch).
I have used 3D UNet and patch size of
48x64x64 for multi-label segmentation.The validation score reaches 74% avg and after that doesn’t increase at all(5 epochs saving criteria).
Is it legit to think that the model may be underfitting?
Any suggestion or feedback appreciated.
Thanks.