I have two data sets D1 and D2. Each data set is composed of two parts: sentences and scores. I want to learn scores for the sentences by an LSTM network in PyTorch. I have examined four scenarios:
        train      validation      test
    ----------------------------------------
90% of D1 5% of D1 5% of D190% of D2 5% of D2 5% of D290% of D1 5% of D1 5% of D290% of D2 5% of D2 5% of D1
Here is the results for these four situations:
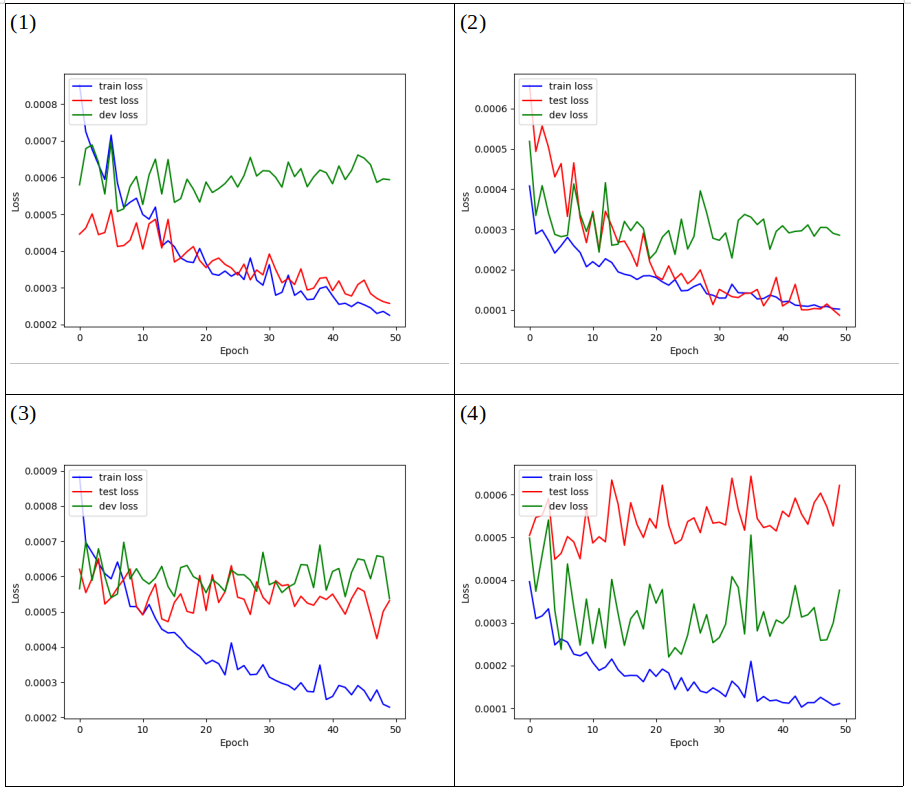
Now I have some questions.
A) Is it normal for my charts to fluctuate so much?
B) Should test loss be up or below of dev loss? (they have different positions in each case)
C)I think that train loss should be always below the test loss. But this is not true always about my cases. Does it show a problem about my model?
D) Why doesn’t dev loss show a clear descending or ascending trend?
E) It seems that test loss has an ascending trend in Fig (4).why?
F)Is it possible that my model is not constructed truly and therefore these Figures are not normal?