Is my loss function normal?

my loss changes along iteration as the figure.
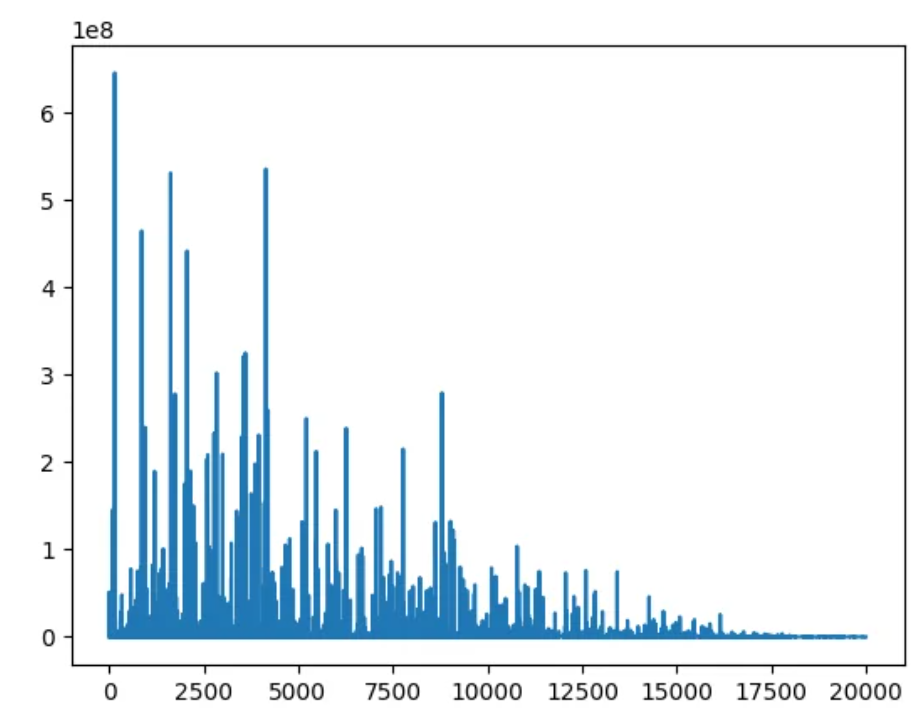
Is my loss normal?

I use “optimizer = optim.SGD(parameters, lr = args.learning_rate, weight_decay = args.weight_decay_optimizer)”, and I train three standalone models simultaneously (the loss depends on all three models dont share any parameters).

Why my loss trend differs from the curves at many papers which decrease in a stable manner?

Help me out. Is the horizontal axis per epoch or per batch?

If per batch(highly likely), that just shows that some batches contribute more loss while others less, progressively getting better.

If per epoch, I’m not sure, that would be an odd chart - perhaps LR is set too high? Definitely going to have over-fitting with 10k+ epochs(and a pricey power bill).