Recently, I bought RTX2060 for deep learning. I installed pytorch-gpu with conda by conda install pytorch torchvision cudatoolkit=10.1 -c pytorch. Of course, I setup NVIDIA Driver too.
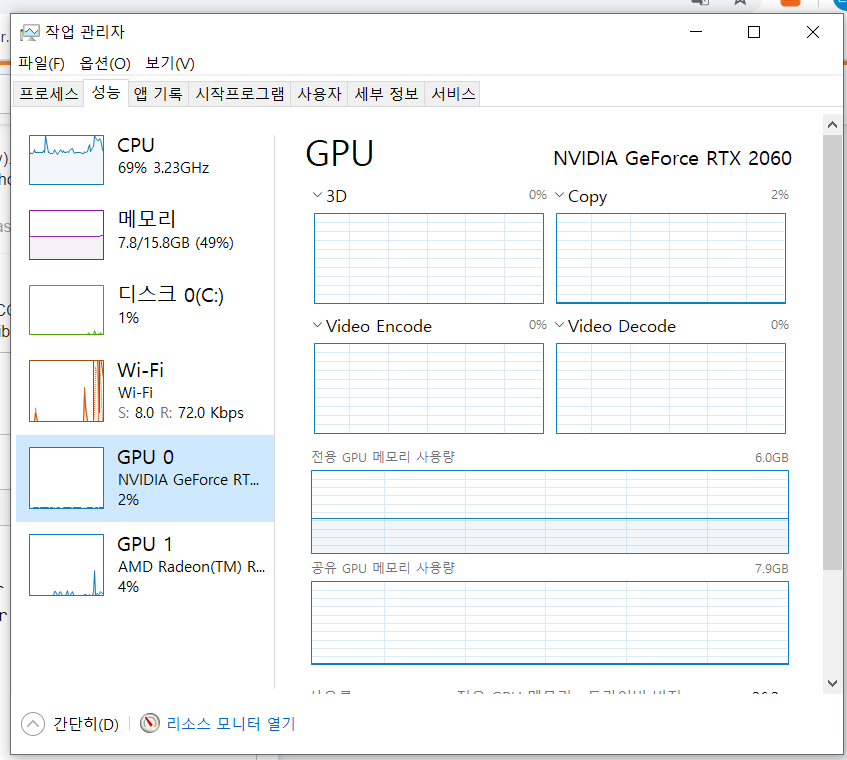
But when i ran my pytorch code, it was so slow to train. So i checked task manger and it seems torch doesn’t using GPU at all!
Rather, as shown in picture, CPU was used highly more than GPU. It’s replying true for torch.cuda.is_available(), but overall training speed and task manager’s graph seems torch can’t utilize GPU well. Is there something I missed? Here are my nvidia-smi.
Sun Mar 29 15:25:26 2020
±----------------------------------------------------------------------------+
| NVIDIA-SMI 431.91 Driver Version: 431.91 CUDA Version: 10.1 |
|-------------------------------±---------------------±---------------------+
| GPU Name TCC/WDDM | Bus-Id Disp.A | Volatile Uncorr. ECC |
| Fan Temp Perf Pwr:Usage/Cap| Memory-Usage | GPU-Util Compute M. |
|===============================+======================+======================|
| 0 GeForce RTX 2060 WDDM | 00000000:01:00.0 Off | N/A |
| N/A 73C P2 61W / N/A | 2779MiB / 6144MiB | 46% Default |
±------------------------------±---------------------±---------------------+
±----------------------------------------------------------------------------+
| Processes: GPU Memory |
| GPU PID Type Process name Usage |
|=============================================================================|
| 0 2984 C …01\Anaconda3\envs\PyTorchGPU\python.exe N/A |
| 0 10636 C …01\Anaconda3\envs\PyTorchGPU\python.exe N/A |
±----------------------------------------------------------------------------+
I had actually missed the nvidia-smi output:
It shows that 2779MiB / 6144MiB (46%) is being utilzed. This implies that the model was successfully loaded into the GPU. One empirical way to verify this is to time it using device = 'cpu' and then time it using device = 'cuda' and verify the different runtimes for a batch size greater than 1(Preferabbly, keep as high a batch size as possible). If the runtimes are the same, there is indeed some issue. Really do not have an answer for the 2% part, though.
I assume this points towards the shown GPU activity in the task manager.
If so, note that the Windows task manager doesn’t show the compute tab by default and you would have to select it via the drop-down menu.
I would recommend to stick to nvidia-smi to see the device utilization.
11% refer to the relative time spend in executing a kernel on the device given a reference timeframe.
E.g. in the last 100ms, 11ms were spent in executing a kernel on the device.
You can push the GPU utilization by trying to push big workloads to the device, as e.g. a lot of small computations will add overhead of the kernel launches etc.
I found that GPU is generally faster than CPU in my MNIST example.
I think that the problem was the batch-size. It was so small so that difference between GPU and CPU was low. Thanks a lot!!
Check out Env-Doctor, an open-source CLI that debugs GPU + CUDA + Python AI env issues (PyTorch, TF, JAX).
It also helps guess the best LLMs that can run locally on your system, among other features!
If you:
• fight CUDA versions
• face toolkit compatibility issues with extension libraries (like flash-attention)
• use Docker / WSL2
• care about better DX in ML