I’m working on an image classification model and evaluating my model by using 4-fold cross-validation. I got very high accuracies when I use SGD with lr=0.01. However, the graph of validation accuracy vs. epoch doesn’t look good at all, see Fig.1.
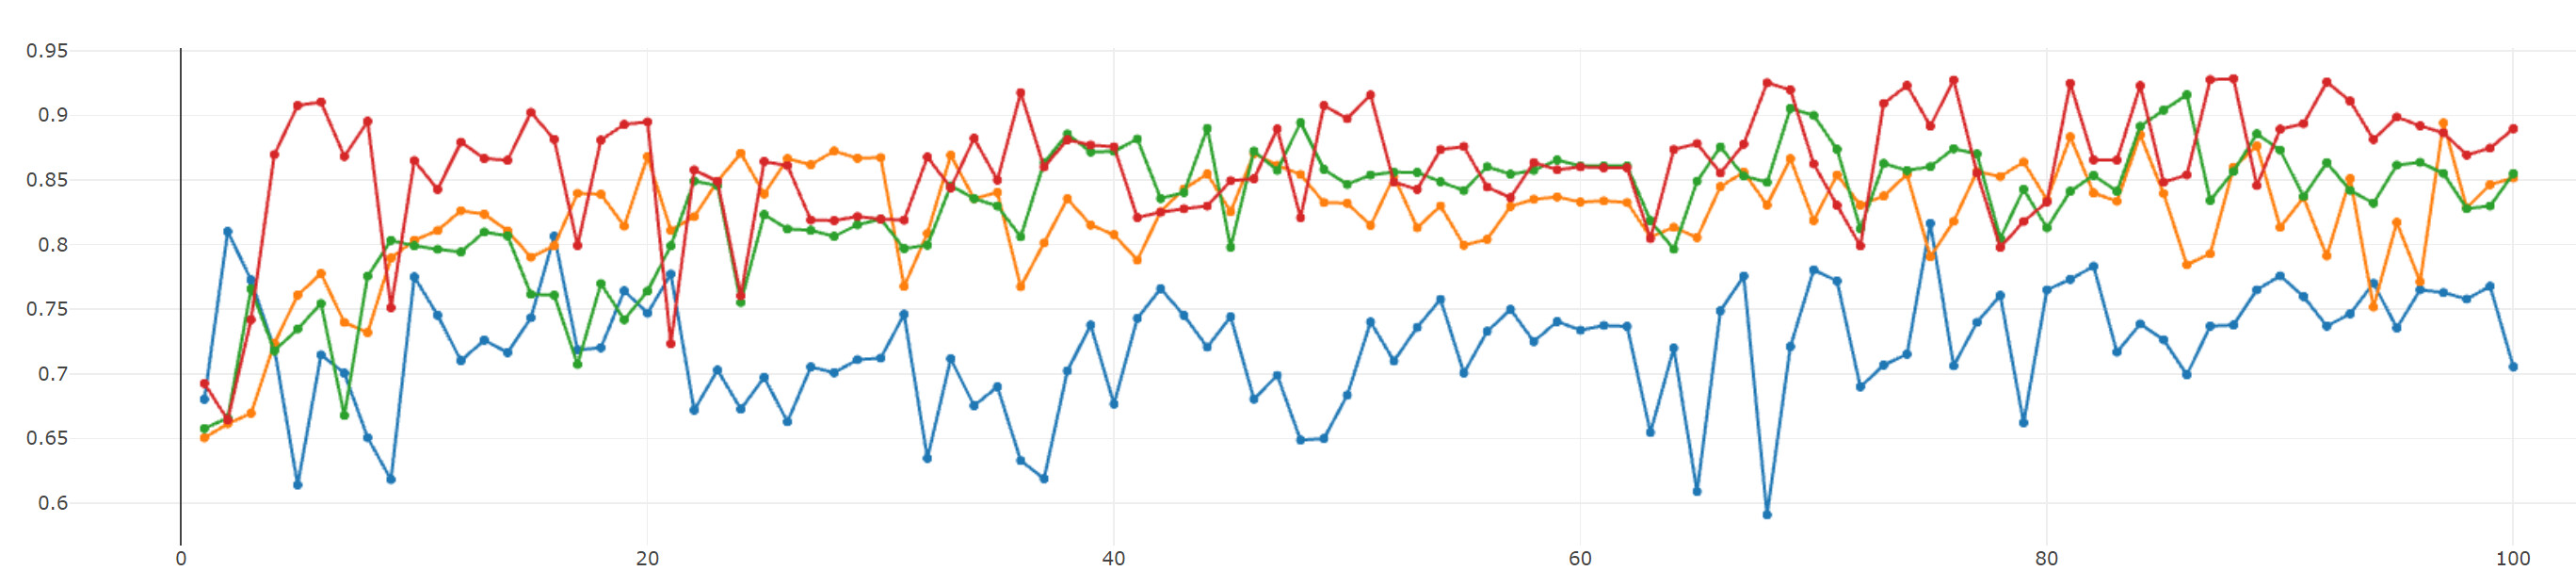
Fig. 1: y-axis and x-axis represent validation acc. and the number of epochs, respectively.
Because it’s really hard to see the trend in the validation accuracy, I tried to lower the learning rate (from lr=0.01 to 0.0005)to see if the graph looks better. The result is shown in Fig 2. I also change the number of epochs from 100 to 200 in this experiment.

Fig. 2: the number of epochs is changed from 100 to 200
Here, the graph looks better (not too much oscillation now) but the overall performance is lower.
The reason that I’m worried about the shape of the validation accuracy is that I want to publish my work in the future but the validation accuracy shown in Fig.1 could convince the reviewers that my training procedure is not right.
So, I would like to know if I should be worried about these things or not as I haven’t published any paper before. Any help or clarification would be appreciated.
Thanks,
Surayuth