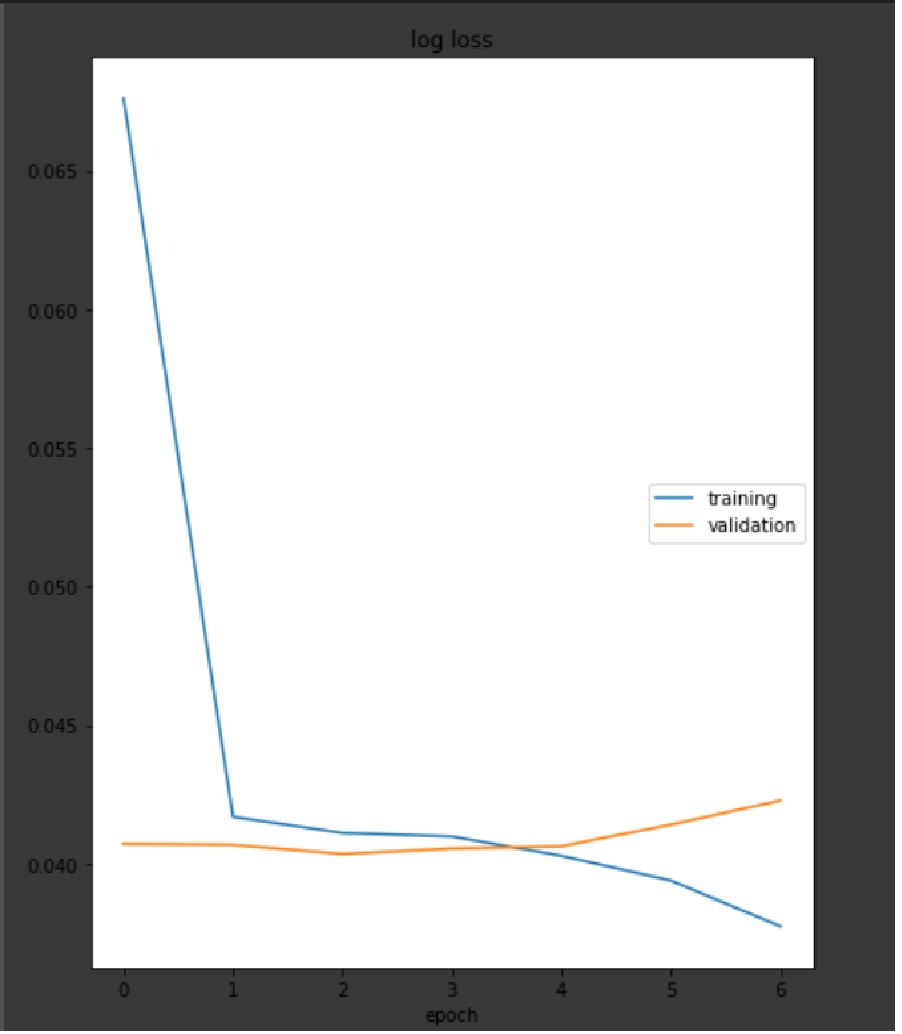
have run my model, I got these two graphs. The first one is on dataset_A( Train = 4500 samples, Eval= 500).
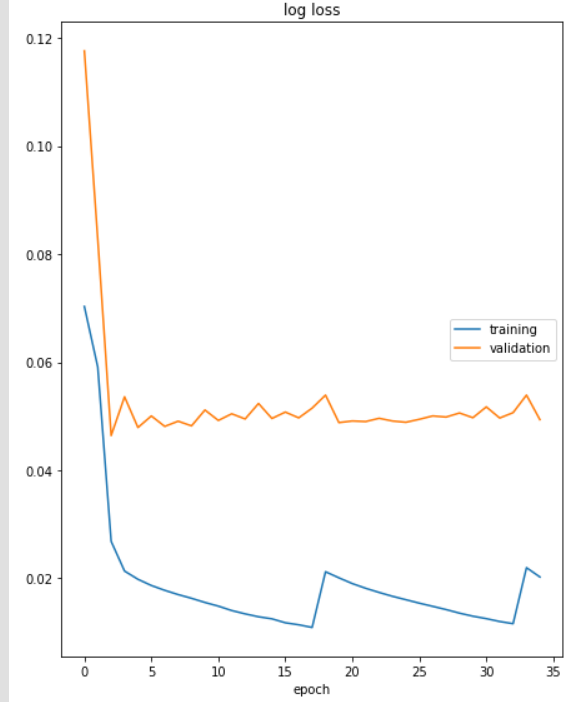
In the second run, I used previous evaluation data (from dataset_A) but new 750-sample train data. Is it reasonable to have these patterns?? I mean loss convergence and values.
Thanks
Since you posted in nlp, I assume your input data is text. I would also assume that your train a classification task, because in this case I’ve also seen a big drop of the training loss after the first epoch. I think(!) this is even more pronounced when using pretrained word embeddings.
The first plot definitely looks “as usual”: the training loss goes down towards overfitting, while the validation loss starts to increase due to that overfitting. The absolute values depend on how exactly you calculate the loss, so they don’t really help.
In the second plot, I’m not sure about the jumps at epoch 17/18 and 32/33. They look rather regular. Do you reset the learning rate or something? The difference in absolute numbers between the 2 plots may stem from the different datasets. I assume, that for the first plot, the training and validation data came from the same dataset. Where do the 750 other samples come from? In any case, 750 is not a large training set – neither is 4,500 – so the overlap in the distribution of the training in validation data might be large.
In short, I don’t see any inherent problems with your graphs, and I can easily explain what I see (maybe part from the jumps). Of course, that doesn’t mean I’m right :).
First, my special thanks go to you.
You are right that’s the NLP task with a siamese network to find the similarity between two sentences. I compute loss by code below. Besides, How can I deal with overfitting in my case well? I found out that augmentation can help, but any suggestions are welcomed.
The reason for jump is that, after a few epochs, if loss gets worse, then I restore the best previous model and decrease the learning rate by multiplying 0.85. (AdamW(MM.parameters(), lr=0.001))
As mentioned earlier, 4500 train samples and 500 eval samples of a dataset for the first plot are used. For the second I altered train samples with new 750 ones from another dataset
LOSS is computed like this:
for i, (xA, xB, score) in enumerate(data_loader, 1):
   total_loss += (loss.item()*len(xA))

epoch_loss = total_loss / len(data_loader.dataset)
Is it OK for showing the result, or should I use cumulative loss like (loss.item() / i ) * len(A) ??
OK, that explains the jumps indeed :). For the training, any normalization of the loss with a constant (here len(xA and len(data_loader.dataset) shouldn’t better. Sure it affects the absolute values of the loss but not the gradients for training.
I’m not aware of Sesame Networks? Do you mean a Siamese Network? I get the idea behind this network architecture but only dabbled once a bit just for some practice.
When you say similarity between two sentences, I assume you refer to semantic similarity – well otherwise you wouldn’t need a Deep Learning model, I guess :). I would argue that this is a very challenging tasks (well, like most NLP task really) since language is extremely flexible and can be very subtle. Even a small change in a sentence can completely alter it’s meaning.
That’s why I never tried data augmentation with text. With images it seems straightforward. Rotating, slight shifting or cropping etc. will still show the same object for classification. I don’t see how to directly map this to text. But that’s just my thought, and I’m anything but an expert!!!
You are right of course. Sorry my bad, it’s a typo which I correct. Just one more thing, I’m pretraining my network by different datasets and wanna use obtained state_dicts for this one. Which one is reasonable to do, ‘‘pre_training one by one for each dataset’’ or ‘‘combine all of the datasets and just do pretraining once’’?