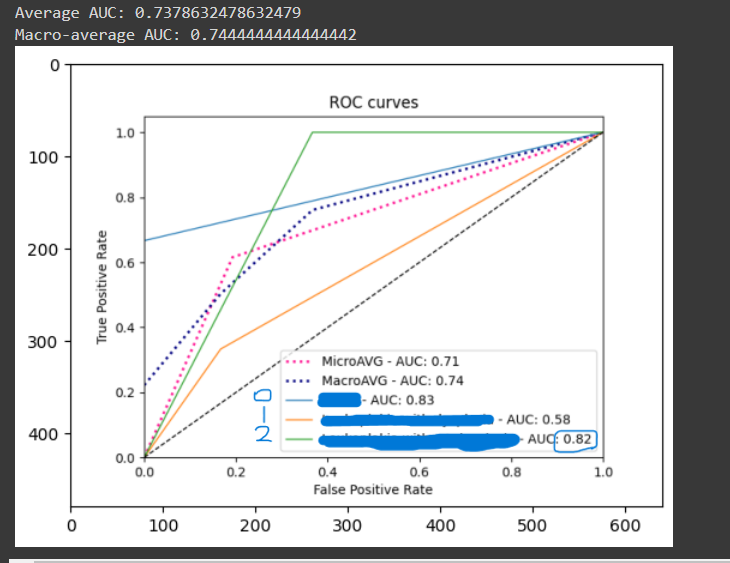
hi i have problem in calculate the AUC in multiclass classification the code is worked and give the result but the result is lower than which should be i don’t now what the problem
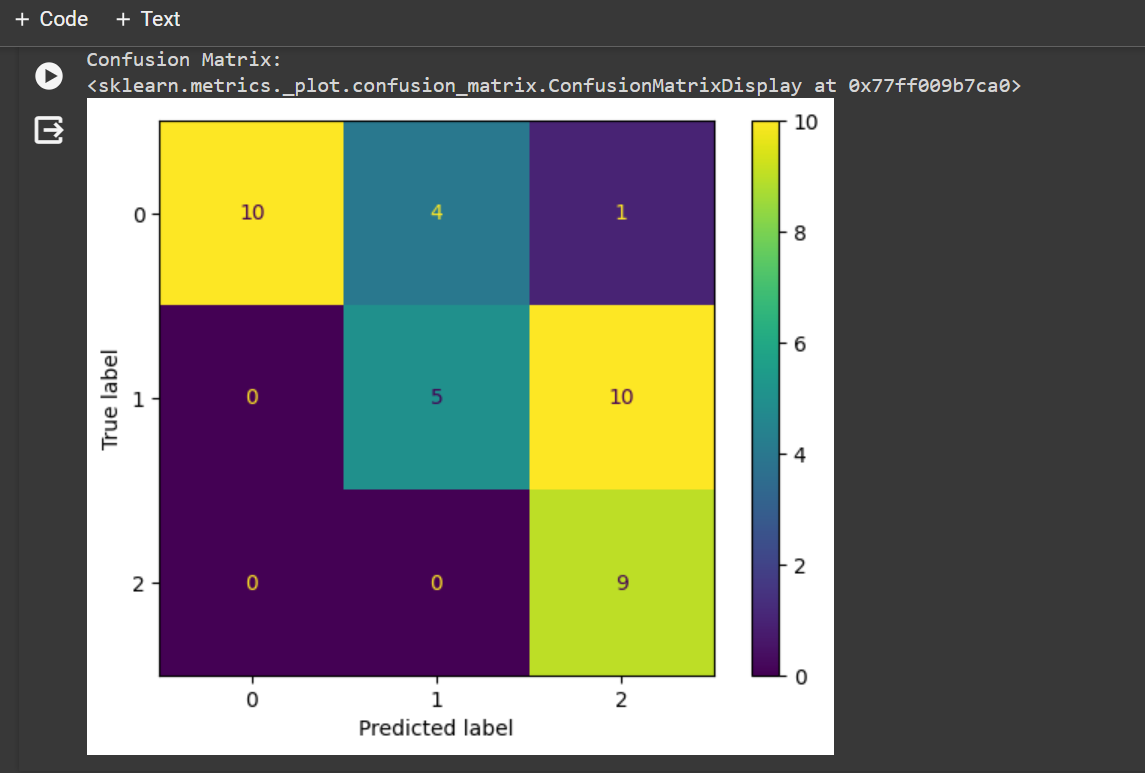
see the result of confusion matrix in class 2 it was classified all the images in right class but in the AUC of this class its 0.82 ?? must be 1.00
the code of AUC
def auc_and_roc_curve (lab_real, lab_pred, class_names, class_to_compute='all', save_path=None):
    """
  This function computes the ROC curves and AUC for each class.
   It better described on: https://scikit-learn.org/stable/auto_examples/model_selection/plot_roc.html#sphx-glr-auto-examples-model-selection-plot-roc-py

    Both lab_real and lab_pred can be a labels array or and a array of scores (one hot encoding) for each class.

    :param lab_real (np.array): the data real labels
    :param lab_pred (np.array): the predictions returned by the model
    :param class_names (list): the name of each label. For example: ['l1','l2']. If you pass a list with a different
    :param class_to_compute (string, optional): select the class you'd like to compute the ROC. If you set 'all', it
    will compute all curves. Note that you should inform a valid class, that is, a class that is inside in class_name.
    Default is 'all'.
    :return: a dictionaty with the AUC, fpr, tpr for each class
    """

    # Checkin the array dimension
    lab_real, lab_pred = _check_dim(lab_real, lab_pred, mode='scores')

    # Computing the ROC curve and AUC for each class
    fpr = dict()  # false positive rate
    tpr = dict()  # true positive rate
    roc_auc = dict()  # area under the curve
    for i, name in enumerate(class_names):
        # print(i, name)
        fpr[name], tpr[name], _ = skmet.roc_curve(lab_real[:, i], lab_pred[:, i])
        roc_auc[name] = skmet.auc(fpr[name], tpr[name])

    if class_to_compute == 'all':

        # Compute macro-average ROC curve and ROC area
        # First aggregate all false positive rates
        all_fpr = np.unique(np.concatenate([fpr[name] for name in class_names]))

        # Then interpolate all ROC curves at this points
        mean_tpr = np.zeros_like(all_fpr)
        for name in class_names:
            mean_tpr += np.interp(all_fpr, fpr[name], tpr[name])

        # Finally average it and compute AUC
        mean_tpr /= float(len(class_names))

        fpr["macro"] = all_fpr
        tpr["macro"] = mean_tpr
        roc_auc["macro"] = skmet.auc(fpr["macro"], tpr["macro"])

        # Computing the micro-average ROC curve and the AUC
        fpr["micro"], tpr["micro"], _ = skmet.roc_curve(lab_real.ravel(), lab_pred.ravel())
        roc_auc["micro"] = skmet.auc(fpr["micro"], tpr["micro"])

        if save_path:
            # Ploting all ROC curves
            plt.figure()

            # Plotting the micro avg
            plt.plot(fpr["micro"], tpr["micro"],
                     label='MicroAVG - AUC: {0:0.2f}'
                           ''.format(roc_auc["micro"]),
                     color='deeppink', linestyle=':', linewidth=2)

            # Plotting the micro avg
            plt.plot(fpr["macro"], tpr["macro"],
                     label='MacroAVG - AUC: {0:0.2f}'
                           ''.format(roc_auc["macro"]),
                     color='navy', linestyle=':', linewidth=2)

            # Plottig the curves for each class
            for name in class_names:
                plt.plot(fpr[name], tpr[name], linewidth=1,
                         label='{0} - AUC: {1:0.2f}'
                               ''.format(name, roc_auc[name]))

    else:

        if save_path:
            plt.plot(fpr[class_to_compute], tpr[class_to_compute], linewidth=1,
                     label='{0} - AUC: {1:0.2f}'
                           ''.format(class_to_compute, roc_auc[class_to_compute]))

    if save_path:
        plt.plot([0, 1], [0, 1], 'k--', linewidth=1)
        plt.xlim([0.0, 1.0])
        plt.ylim([0.0, 1.05])
        plt.xlabel('False Positive Rate')
        plt.ylabel('True Positive Rate')
        plt.title('ROC curves')
        plt.legend(loc="lower right")

        if isinstance(save_path, str):
            plt.savefig(save_path)
            plt.clf()
        elif save_path:
            plt.show()


    return roc_auc, fpr, tpr
the called after test phase was done
from sklearn.metrics import roc_auc_score

from sklearn.preprocessing import LabelBinarizer

import matplotlib.image as mpimg

lb = LabelBinarizer()

lb.fit(val_labels)

test_labels_onehot = lb.transform(test_labels)

test_predicted_onehot = lb.transform(test_predicted)

roc_auc2, fpr, tpr = auc_and_roc_curve(test_labels_onehot, test_predicted_onehot, class_names, save_path="/content/drive/MyDrive/my_models/test_img_roc_curve.png")

print(f"Test AUC for Each Class: {roc_auc2}")

avg_auc2 = sum(roc_auc2.values()) / len(roc_auc2)

print(f"Average AUC: {avg_auc2}")

print(f"Macro-average AUC: {roc_auc2['macro']}")

img = mpimg.imread('/content/drive/MyDrive/my_models/test_img_roc_curve.png')

# Display the image

imgplot = plt.imshow(img)

plt.show()
Thank you …
if an expert need to understand the problem i can send the notebook file in colab