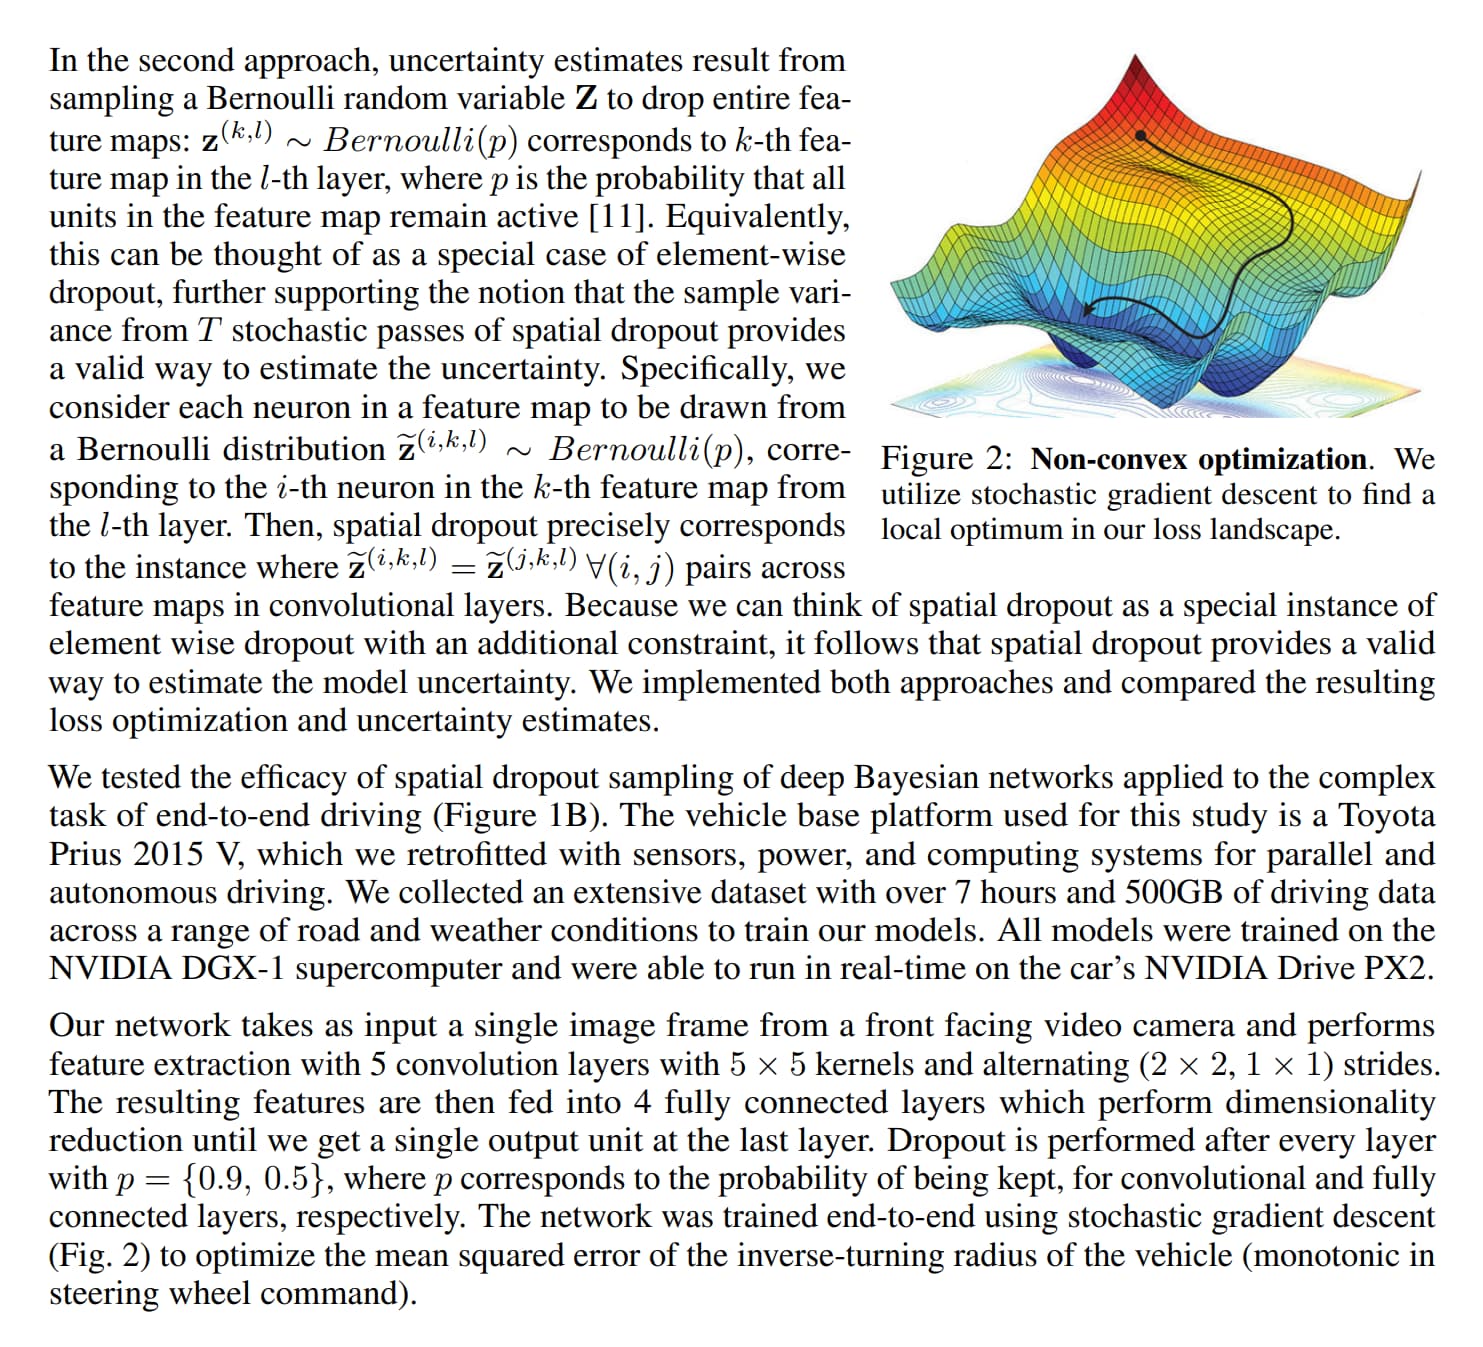
I’m looking for the lost function, and data associated, that was used to generate the “lost landscape” (aka, scalar field) image shown on the following article published on Science. Hope someone can shed a light. Thanks.
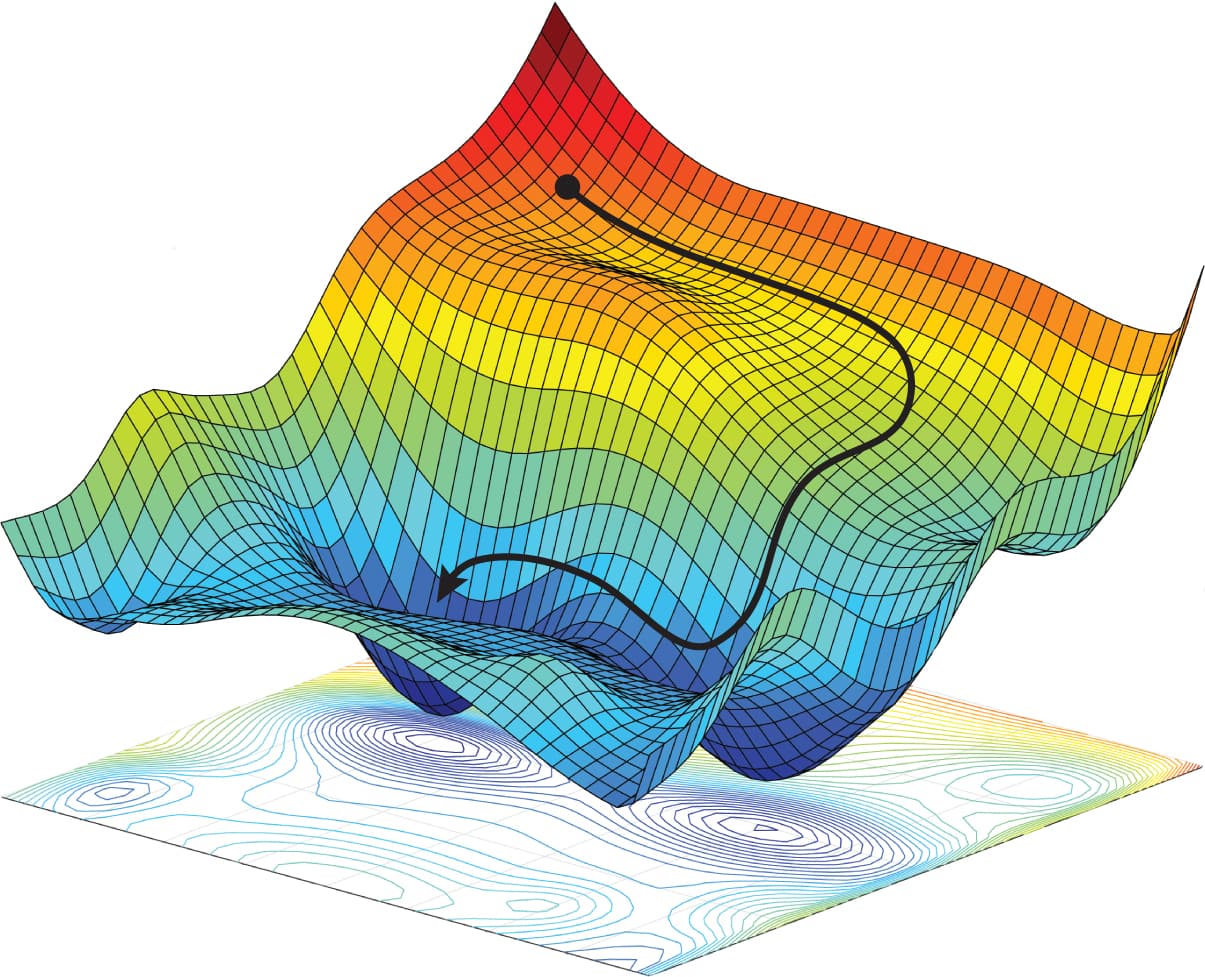
Source: “IMAGE: ALEXANDER AMINI, DANIELA RUS. MASSACHUSETTS INSTITUTE OF TECHNOLOGY, ADAPTED BY M. ATAROD/SCIENCE”
[article link] (https://science.sciencemag.org/content/360/6388/478/tab-figures-data)