What does this kind of curve represent? Under-fitting? Why only the training accuracy is weird?
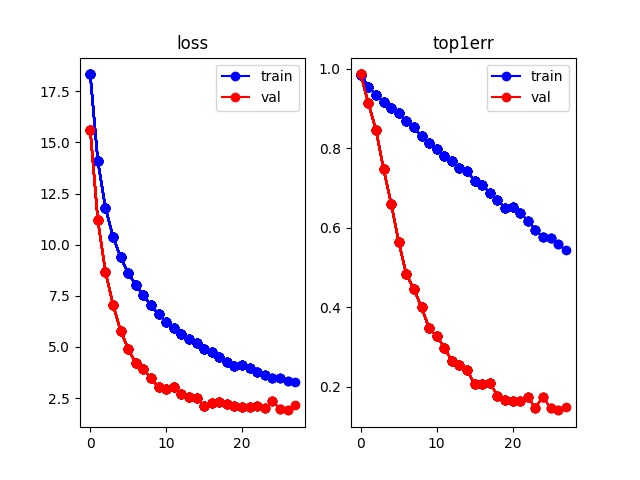
It could under-fitting. But, since the model is training correctly, I guess these gaps show that the distributions of your train & validation sets aren’t the same. For instance, say that you can easily identify two kinds of inputs: easy vs hard to predict. Imagine that you got the following distribution:
| Easy | Hard | |
|---|---|---|
| Train set | 20% | 80% |
| Validation set | 50% | 50% |
You would likely find the loss and accuracy curves like you pasted here. So, I’d recommend you to check that the distributions of train and validation sets are the same.
1 Like
@LeviViana is right. But that can be one possible explanation. More comments can be given if you please share about the dataset used, about the train/validation split and loss function used for training. Because in some cases train loss reduction doesn’t mean improvement in performance.