I just counter a strange problem recently.
I have a very normal ConvNet and doing some image restoration tasks.
The overall training is fine, my model can yield good results, but the behavior of the first epoch is kinda strange and I just need to confirm if there is something wrong:
the loss at the end of first epoch is like 6,000,000+, but instantly decrease to less than 10 on second epoch and then everything seems normal…after 100 epochs the loss is around 5.
Any explaination for this phenomenon, or does anyone counter this before?
Thanks in advance.
Depending on the use case, i.e. which loss function you are using, number of classes etc., you could calculate the “expected” loss for random outputs.
If the initially high loss value does not match the use case, e.g. your initialization might be bad for the use case and thus your model would perform worse than predicting random outputs (e.g. it could be very confident in wrong labels).
1 Like
Hi @ptrblck,
Thanks for the reply.
The task I am working on is similar to Super-resolution, and the loss we use is MSE.
so basically we mesure the difference between each pixel and use MSE to calculate the loss.
for 1 epoch, there are 20000 iterations, and loss in 1st epoch will decrease from 10M+ to 6M+,
but instantly drop to around 10 at the begining of 2nd epoch.
for random input the loss is very high, just like what I observed during training.
Thus I still dont understand why second epoch the loss will drop that much…though the model gives good test result in the end anyway…
Hello @ptrblck
Actually I’m facing another issue while training the model. I’m getting loss(MSE loss) in the range of micro in the very first epoch. My dataset has input image tensors containing values in the range of 10^-4 to 10^-8 but all positive. My predicted image tensor contains values in the similar range but some values are negative also. And I tried to visualise the predicted image, it just looks like a shade of grey.
How does the visualization of the target look? I would guess that the small (abs) values might be causing the gray-ish output if e.g. matplotlib maps the input range of [0, 1] to all available colors.
Could you compare the target and output visualization and if they are approx. equal check if you could adapt the colormap of imshow?
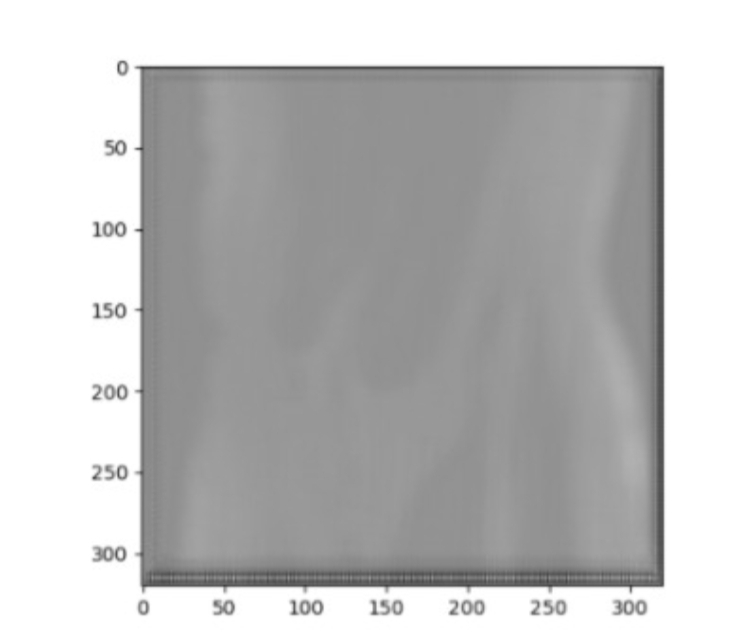
Yes, I tried to visualise predicted(output) and target images. My predicted image doesn’t show any information, I’m attaching the image here. My input and target images are fine but predicted image didn’t learn anything.
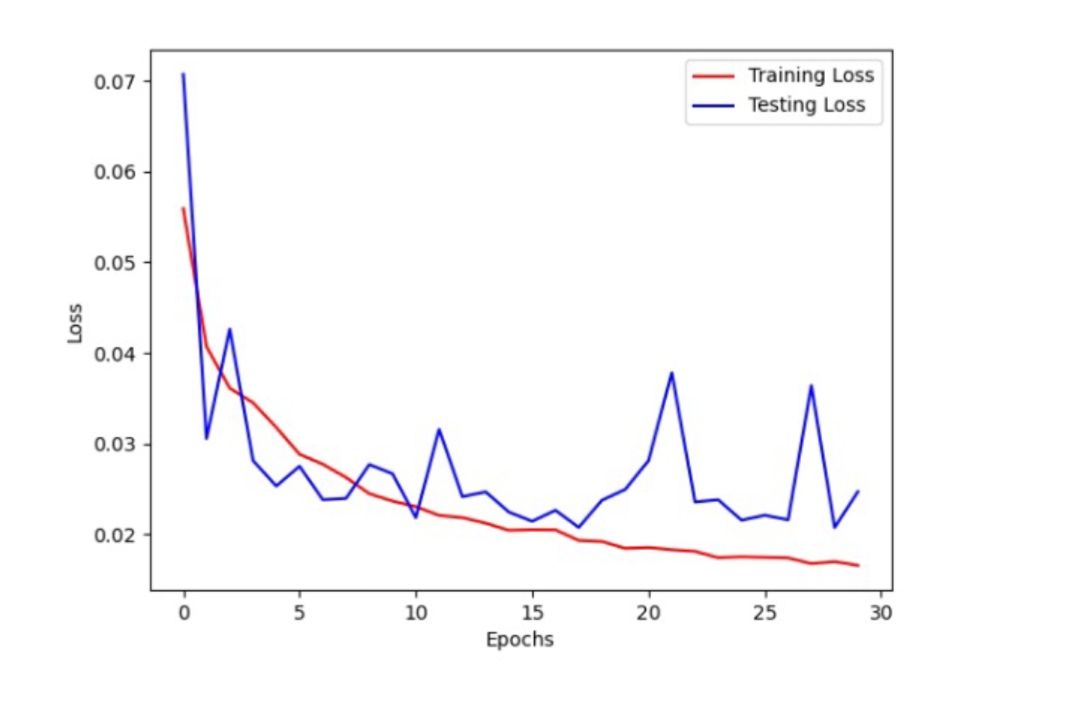
After that I tried to train the model by multiplying all my input with 10^4, then when I visualised the predicted images it was close to the target images. But the loss still doesn’t seems to be fine enough.
This was my loss vs epoch graph for training and testing.
Scaling the inputs (and targets) during training might be a proper workaround for small absolute values (we’ve been discussing this idea in other threads as well, so you might want to search for it).
Can you provide me the link for that thread?
This is one discussion I could find. There I describe a use case where the original target was in [0, 96] and where scaling the target range to [0, 1] during training (and unscaling it to the original range during prediction) worked better than trying to directly learn the target range.
I’m sure a proper weight and bias initialization would also work, but this was a quick way to let the model learn.
Okay, thanks. Will check.