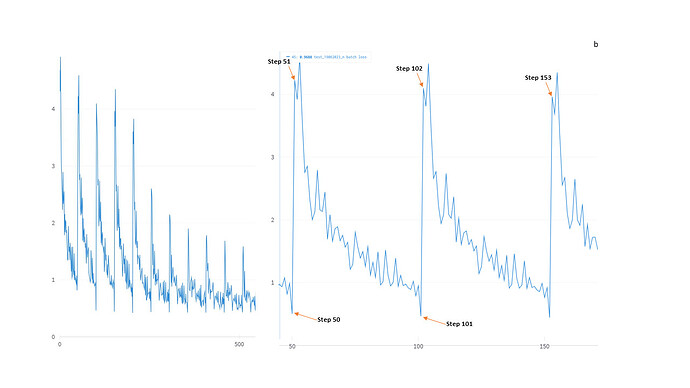
Loss function oscillations - periodic curve per epoch

I am training a network, and the batch-averaged per-epoch loss decreases iteratively during training. But, the curve of the per-batch loss is suspiciously periodic.

To the left is the overall curve of the per-batch loss, and to the right is a zoom-in on one area to show the periodicity:

I am using a DataLoader, and am not utilizing shuffling. batch-size is 80, and the size of the last batch is 62. I realize shuffling would help, but I think that there is a more serious issue resulting in this exact periodicity. I should note that there are 29 batches in an epoch, and the periodicity (distance between the same repeating peak in repeating sections) is 31 epochs apart.

As a loss for the batch, I am using a sum of 5 seperate MSELoss elements:

mse_loss = torch.nn.MSELoss()
total_loss = mse_loss(guess_a,coord_a) + mse_loss(guess_b,coord_b) + mse_loss(guess_c,coord_c) + mse_loss(guess_d,coord_d) + mse_loss(guess_e,coord_e)

Hi Yoav!

Curiouser and curiouser …

I have some clarifying questions and a couple of suggestions.

To confirm:

Do you mean by this that every epoch contains the exact same sequence
of batches (in the same order) every time through? (And that each specific
batch at a given position within the epoch contains the exact same data
samples?)

Did you mean that the distance between repeating peaks is 31 batches or is
it indeed “31 epochs,” as you said? “Batches” seems to fit the context better.

If it is batches, could you confirm that the periodicity really is different than the
number of batches in an epoch? This looks very much as if as you go through
the same sequence of batches you get approximately-matching patterns in
your loss function. It would seem very odd if as you go through the same
sequence of batches from epoch to epoch, different batches give you “matching”
values of the loss function (for example, different batches give you the peak).

Are you using any sort of learning-rate scheduler?

Could you post your zoomed-in loss graph, annotating the top peak and bottom
valley (as well as, perhaps, a couple other landmarks) with the batch number
(or epoch number, if they really are epochs)?

Try making the same graph with training turned off. That is, run the exact same
code, but simply skip the optimization step or maybe set the learning rate to
zero. (You might also try training for a bit before turning off the training just to
let things stabilize a little bit.)

Assuming that you are using pytorch’s DataLoader class, you might try setting
drop_last = True. I think its a long shot (because the last-batch size of 62 is
really not that different from 80), but maybe your last batch is giving your training
an unhelpful jolt that causes your loss function to spike up.

And, yes, turning on shuffling would make sense, but that would mask the
interesting effect that you’re currently seeing.

Best.

K. Frank

Hello Frank,

Thanks for this!!

  1. Here is the setup of the data loader:
    train_loader = DataLoader(train_set, batch_size = batch_size, shuffle = False)
    So - during each epoch, batches are provided at the same order.

  2. Sorry for the confusion in phrasing my original question - I meant batches, as you mentioned. The periodicity is exactly the same as the number of batches in an epoch, every time.

  3. For optimization, I am currently using:

optimizer = torch.optim.Adam(model.parameters(),lr=learning_rate,betas=(0.9,0.999),eps=1e-08,weight_decay=0,amsgrad=True)

where lr is=0.001

  1. In the following chart - lr = 0.001, batch size = 40; the size of the training set is 2,030, therefore there are 51 training batches in an entire epoch. I am not shuffling their order for now, as mentioned. To the left - the overall batch loss curve, to the right - zoomed in on a region. each repeating area is exactly one epoch wide - batch 50 (step 50) is the last batch of the first epoch (starts from 0); step 51 is the first batch of the second epoch and 101 is the last of this epoch, etc.

  2. Setting lr = 0 resulted in a very similar batch loss curve, only without any decay of the peak height, and instead of being very similar, the periods are identical.

  3. Regarding setting drop_last = True and shuffling - thanks, I will incorporate these later after the current mystery gets resolved.

I should mention my dataset is small (won’t get into the details of describing its nature). I would not be surprised if the data/architecture are not sufficient for significant learning, but I remain puzzled about the periodic pattern - if nothing is learned, I wonder why is the overall per-epoch loss decreasing.

Thanks for any advice!

Hi Yoav!

This strongly suggests that something is “jolting” your training at the
beginning (or perhaps the end) of each epoch.

Are you instantiating a new copy of your optimizer every epoch? Adam
maintains state and smooth training would be disrupted if that state were
zeroed out every epoch.

You might try using SGD (with no momentum) for your optimizer, as it
carries no state.

Could you be calling optimizer.zero_grad() or loss.backward()
once per epoch instead of for every batch?

Are you using some kind of learning-rate scheduler that jumps or resets
every epoch.

In any event, look for something in your code that does something different
between epochs than it does between samples within an epoch.

Good luck.

K. Frank