Low GPU Usage during Training

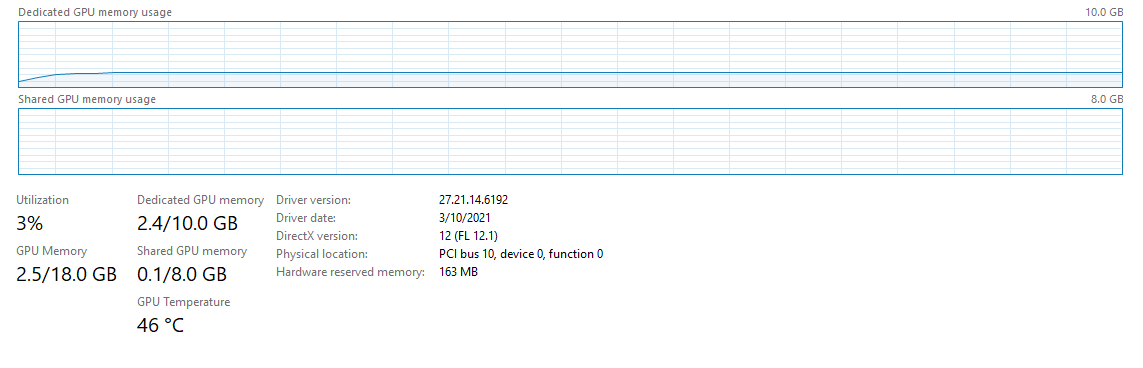
Hi! I am training a Convnet to classify CIFAR10 images on RTX 3080 GPU. For some reason, when I look at the GPU usage in task manager, it shows 3% GPU usage as shown in the image.

The model is as follows

class ConvNet(nn.Module):
    
    def __init__(self):
        super(ConvNet,self).__init__()
        
        self.conv1 = nn.Conv2d(in_channels=3,out_channels=8,stride=1,kernel_size=(3,3),padding=1)
        self.conv2 = nn.Conv2d(in_channels=8,out_channels=32,kernel_size=(3,3),padding=1,stride=1)
        self.conv3 = nn.Conv2d(in_channels=32,out_channels=64,kernel_size=(3,3),padding=1,stride=1)
        self.conv4 = nn.Conv2d(in_channels=64,out_channels=128,kernel_size=(3,3),padding=1,stride=1)
        self.conv5 = nn.Conv2d(in_channels=128,out_channels=256,kernel_size=(3,3),stride=1)

        self.fc1 = nn.Linear(in_features=6*6*256,out_features=256)
        self.fc2 = nn.Linear(in_features=256,out_features=128)
        self.fc3 = nn.Linear(in_features=128,out_features=64)
        self.fc4 = nn.Linear(in_features=64,out_features=10)
        
        self.max_pool = nn.MaxPool2d(kernel_size=(2,2),stride=2)
        self.dropout = nn.Dropout2d(p=0.5)
        
    def forward(self,x,targets):
        x = self.conv1(x)
        x = F.relu(x)
        x = self.conv2(x)
        x = F.relu(x)
        x = self.max_pool(x)
        x = self.conv3(x)
        x = F.relu(x)
        x = self.dropout(x)
        x = self.conv4(x)
        x = F.relu(x)
        x = self.max_pool(x)
        x = self.conv5(x)
        x = F.relu(x)
        x = self.dropout(x)
        x = x.view(-1,6*6*256)
        x = self.fc1(x)
        x = F.relu(x)
        x = self.fc2(x)
        x = F.relu(x)
        x = self.fc3(x)
        x = F.relu(x)
        logits = self.fc4(x)
        
        loss = None
        if targets is not None:
            loss = F.cross_entropy(logits,targets)
        return logits,loss
    
    def configure_optimizers(self,config):
        optimizer = optim.Adam(self.parameters(),lr=config.lr,betas=config.betas,weight_decay=config.weight_decay)
        return optimizer

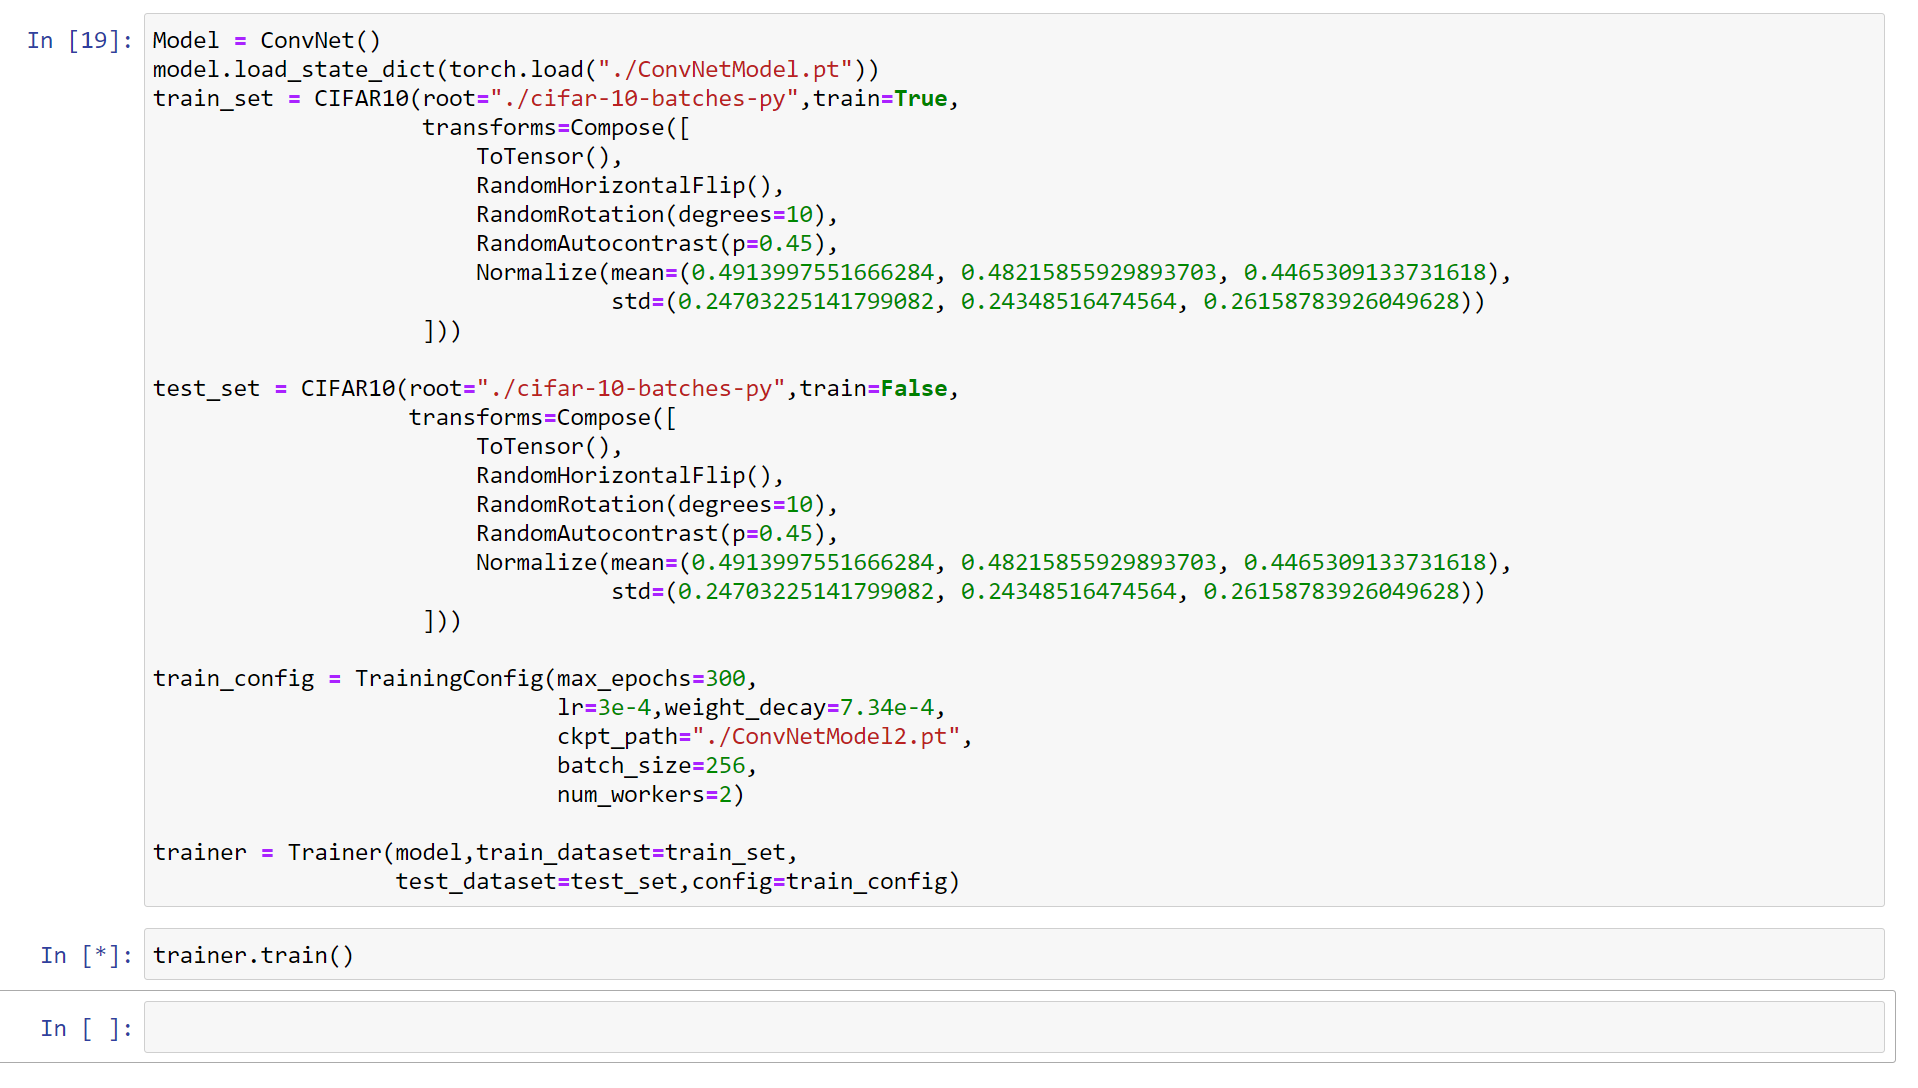
Training Configurations are as follows:
Epochs : 300
Batch Size : 64
Weight Decay : 7.34e-4
Learning Rate : 3e-4
Optimizer : Adam

Also I am running several transforms such as Normalization, RandomRotation, RandomHorizontalFlips.

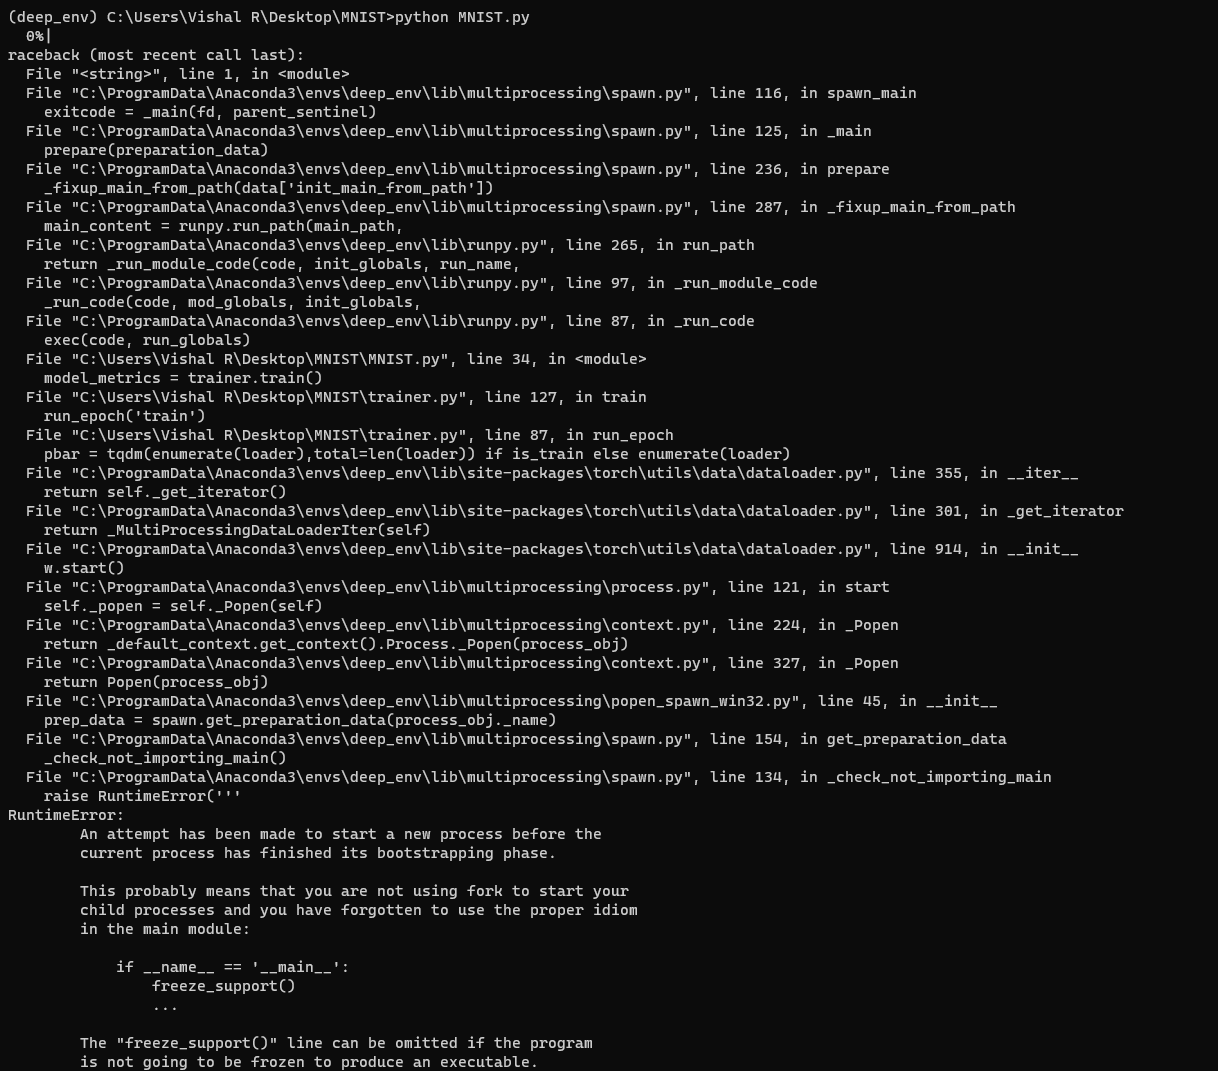
Also I have another bug. When I change the number of workers in DataLoader, the training just begin at all. In jupyter notebook, it shows that cell is being executed but no output is shown. So I am forced to run with num_workers=0. Anything above 0 breaks for some reason.

try typing

watch nvidia-smi

in your shell at the same time while training is happening it will show the real memory usage of your model and utilization.

I am on Windows 10. I tried using watch nvidia-smi in notebook. It gives syntax error.

Update:

I managed to find a command to get GPU stats. It shows that it is using 14% GPU. Isn’t that low? I am training a big model right?

In jupyternotebook when you press new then click terminal, tyoe the comman there

Yeah even though you use bigger model it depends on the batch size and total computation done by the GPU. Try increasing the batch size and do watch nvidia-smi to see continuously on the memory and utilization.

I increased batch_size to 256. The GPU usage is now 10%. It was 14% when batch_size was 64.

Also I have seen in many YouTube videos that if we use a very large batch size the overall generalization of the model decreases and hence the validation accuracy goes down. Is that true?

Low GPU utilization problem - PyTorch Forums

As you see the link you need to increase the num_workers. As that might be one of the cause

Yeah.

But if I increase the num_workers to say like 2 or something, for some reason, it breaks the training process. It doesn’t start training at all. It only trains when num_workers=0. I don’t know why it is happening.

This is the problem I am getting if I change the num_workers to anything above 0. I don’t know why it doesn’t work for me.

Also I have seen some YouTube videos suggesting to keep the batch_size to 32,64 like that. They tell not to use very large batch_sizes as it reduces the generalization of the model. Is it true?

Yeah generalization of model dependent and according to me depend on the no of classes you have in your dataset. So it is mostly dependent on the type of the dataset you have in hand. But ideally 32,64,128,256 works depends on datasets. If someone have very big images they will use batch sizes like 4 4,8,16 also because of memory constraints.

I am not sure about which trainer you are using.

I am using a custom training loop that I found on Andrej Karpathy’s MinGPT repo. I thought it was a nice way of doing it. Even if I did not use that trainer and used a simple training loop, the DataLoader with num_workers>0 doesn’t work.

Link : trainer.py

can you print loss after line 83

print("---",loss.item())

As you mentioned, I have printed loss after the loss.mean() line in the trainer.

increase the batch size and workers and see if the loss is still printing

No it does not print anything. It gets stuck like this and I cannot interrupt the kernel as well.

can you change batchsize to like 4 or 8 or 16

I am still getting the same result.

I tried running an earlier project that I did for training MNIST digits. There I changed num_workers=2 and ran it in terminal instead of running on notebook.

This is what I have got.

I have used PyTorch’s MNIST dataset itself and trained using the trainer class.

can you share your complete mnist code here?

I have uploaded it to my github.

Link : MNIST-PyTorch