Hello everyone, I can’t find the bottleneck of my training program.
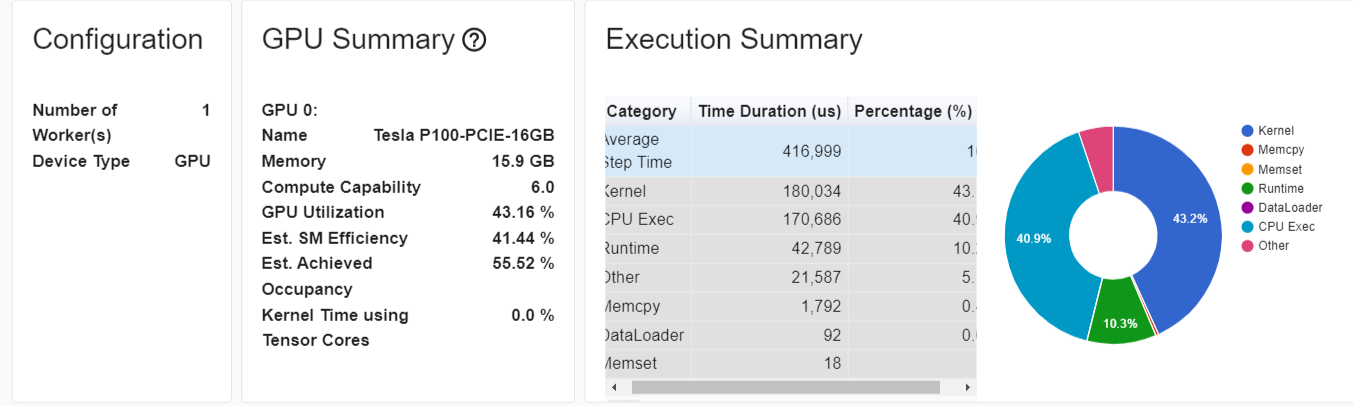
As you can see the gpus utilization is low 43% (I am using bsz of 40 which consumes 12GB/16GB).
The bottleneck isn’t from the dataloading as you can see. It seems to come from the forward and backward…
When I check the operators execution time on CPU, for some reason they consume CPU time. I am only using native pytorch tensors in my forward and loss computation.
https://imgur.com/a/VdVqTTY
I profiled the forward separately, and it show a CPU usage of 2s. But the individual operations don’t sum to 100% CPU total. I am confused.
-------------------------------------------------------  ------------  ------------  ------------  ------------  ------------  ------------  ------------  ------------  ------------  ------------
                                                   Name    Self CPU %      Self CPU   CPU total %     CPU total  CPU time avg     Self CUDA   Self CUDA %    CUDA total  CUDA time avg    # of Calls
-------------------------------------------------------  ------------  ------------  ------------  ------------  ------------  ------------  ------------  ------------  ------------  ------------
                                          model_forward         0.40%       8.407ms       100.00%        2.106s        2.106s       0.000us         0.00%      51.656ms      51.656ms             1
                                              aten::bmm         0.14%       3.033ms         0.30%       6.262ms     313.100us      23.576ms        45.64%      23.576ms       1.179ms            20
                                maxwell_sgemm_128x64_nn         0.00%       0.000us         0.00%       0.000us       0.000us      18.129ms        35.10%      18.129ms       2.014ms             9
                                             aten::add_         0.52%      10.907ms         0.55%      11.569ms     236.102us      11.983ms        23.20%      11.983ms     244.551us            49
void at::native::unrolled_elementwise_kernel<at::nat...         0.00%       0.000us         0.00%       0.000us       0.000us      11.282ms        21.84%      11.282ms     245.261us            46
                                          aten::softmax         0.00%      67.000us         0.34%       7.056ms     705.600us       0.000us         0.00%       8.552ms     855.200us            10
                                         aten::_softmax         0.08%       1.584ms         0.33%       6.989ms     698.900us       8.552ms        16.56%       8.552ms     855.200us            10
void (anonymous namespace)::softmax_warp_forward<flo...         0.00%       0.000us         0.00%       0.000us       0.000us       7.342ms        14.21%       7.342ms       1.049ms             7
                                maxwell_sgemm_128x64_tn         0.00%       0.000us         0.00%       0.000us       0.000us       5.623ms        10.89%       5.623ms     401.643us            14
                                           aten::linear         0.02%     344.000us         2.03%      42.657ms       1.066ms       0.000us         0.00%       2.733ms      68.325us            40
-------------------------------------------------------  ------------  ------------  ------------  ------------  ------------  ------------  ------------  ------------  ------------  ------------
Self CPU time total: 2.106s
Self CUDA time total: 51.656ms
Thank your for your help.