Hi, i am trying to create a LSTM model for predicting a sine wave function. I want to eventually be able to implement this using only basic operations within the autograd system.
But for testing out things i am using the torch.nn.LSTM for now.
import torch
import matplotlib.pyplot as plt

# Parameters
INPUT_LEN = 400
SEQ_LEN = 20
INPUT_SIZE = 1
NUM_LAYERS = 1
HIDDEN_SIZE = 1
BATCH_SIZE = 40

# training data
X = (torch.arange(2 * INPUT_LEN, dtype=torch.get_default_dtype()) / INPUT_LEN).reshape(SEQ_LEN, BATCH_SIZE, INPUT_SIZE)
y = torch.sin(2 * np.pi * X).reshape(SEQ_LEN, BATCH_SIZE, HIDDEN_SIZE)

rnn = torch.nn.LSTM(INPUT_SIZE, HIDDEN_SIZE)

optim = torch.optim.Adam(rnn.parameters())

for epoch in range(20):
    # the first cell will neither have a previous output or
    # a previous hiddens state, set them to zero
    h0 = torch.zeros((NUM_LAYERS, BATCH_SIZE, HIDDEN_SIZE))
    c0 = torch.zeros((NUM_LAYERS, BATCH_SIZE, HIDDEN_SIZE))

    out, (h_out, c_out) = rnn(X, (h0, c0))

    optim.zero_grad()

    # Mean squared error loss
    loss = torch.tensor(y).sub(out).pow(torch.tensor(2)).sum().div(torch.tensor(SEQ_LEN*BATCH_SIZE))
    loss.backward()

    optim.step()

N_STEPS = 20 # number of time steps to predict

X = (torch.arange(2 * INPUT_LEN, dtype=torch.get_default_dtype()) / INPUT_LEN)
y = torch.cos(2 * np.pi * X)
y_init = y[:N_STEPS]

# start with initial values, rest will be predicted
y_pred = y_init
for i in range(len(X) - N_STEPS):
    inp = y_pred[i:i + N_STEPS].reshape(N_STEPS, INPUT_SIZE, HIDDEN_SIZE)
    out, (h_out, c_out) = rnn.forward(inp)
    # h_out is the output for t = seq_len
    y_pred = torch.cat((y_pred, h_out.flatten()))

# detach results
X = X.detach().numpy()
y = y.detach().numpy()
y_pred = y_pred.detach().numpy()
y_init = y_init.detach().numpy()

# plot result
plt.plot(X[N_STEPS:], y_pred[N_STEPS:], label="prediction")
plt.plot(X, y, label="ground truth")
plt.plot(X[:N_STEPS], y_init, label="initial sequence", color="red")
plt.legend(loc="upper left")
plt.show()
This code does not seem to train the model at all. I suspect there might be something wrong with the defined loss function (MSE). The loss stays around 0.6.
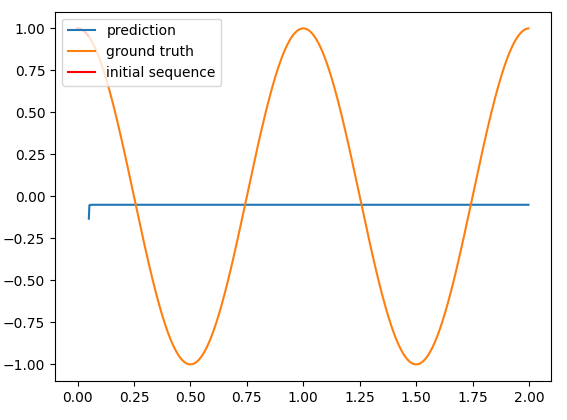
I want the prediction (blue line) to correctly predict the ground truth (orange line).