I was profiling a GNN training program using the PyTorch profiler. Following the tutorial, I exported a Chrome trace.
My program runs on a CPU-only platform. The GNN program is implemented with Deep Graph Library and uses PyTorch as backend.
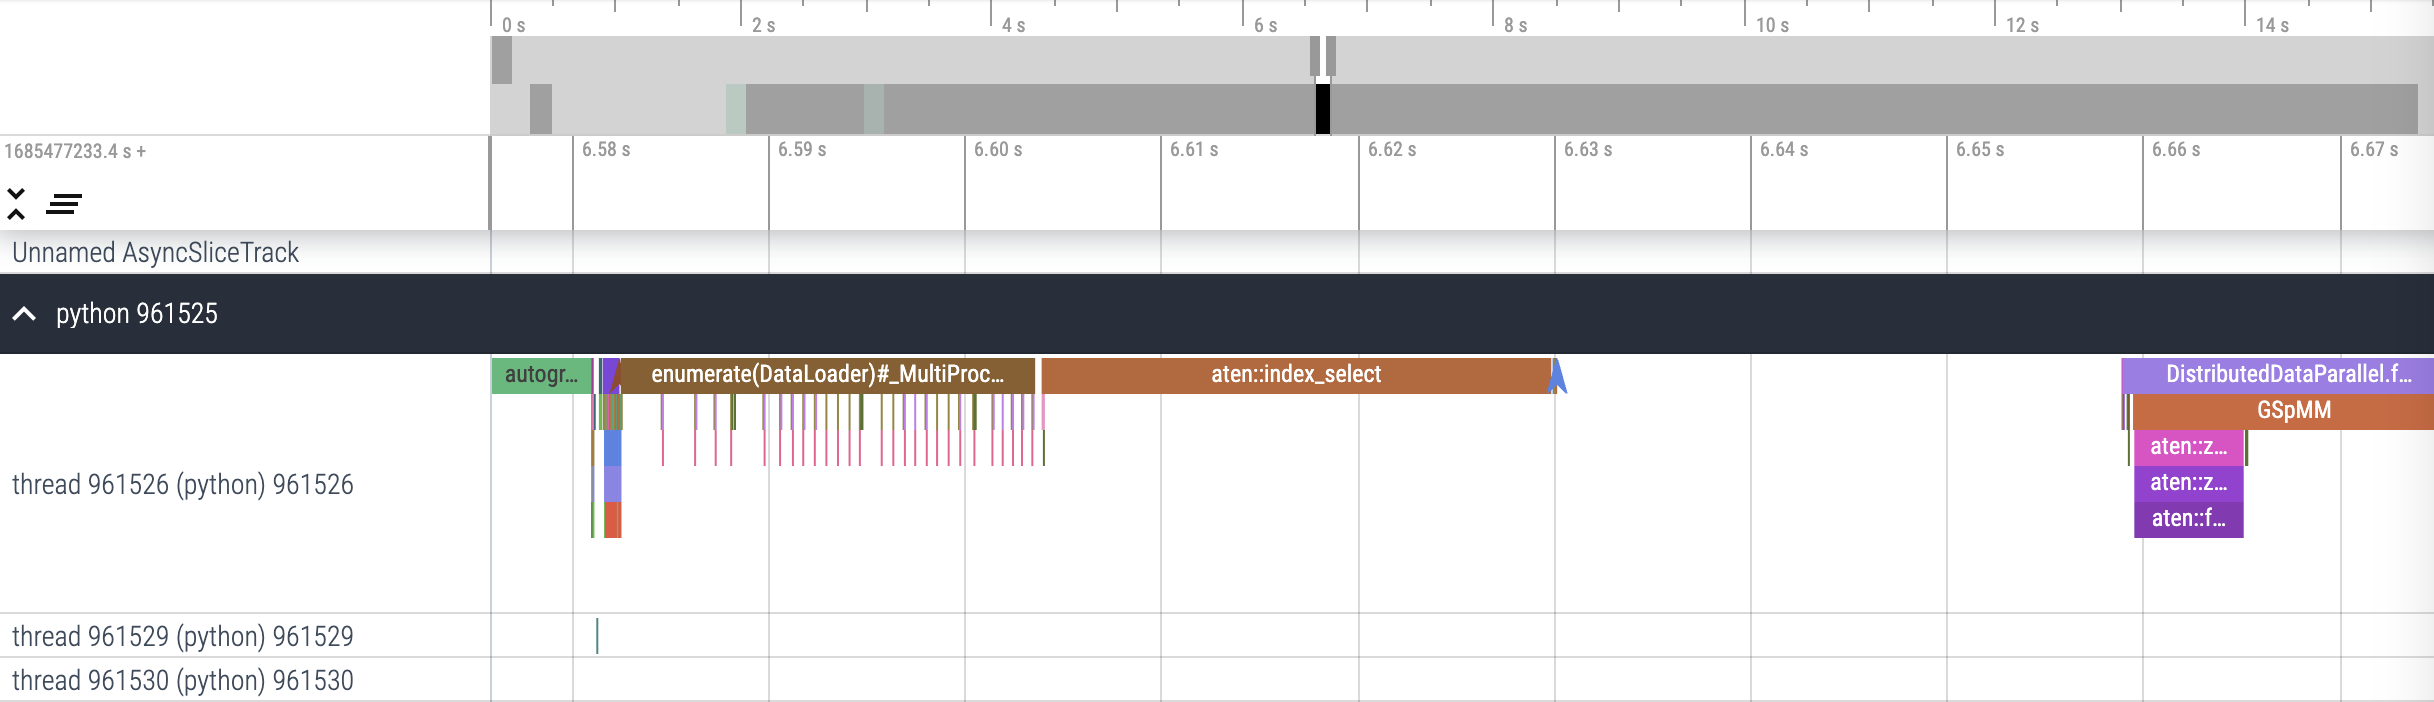
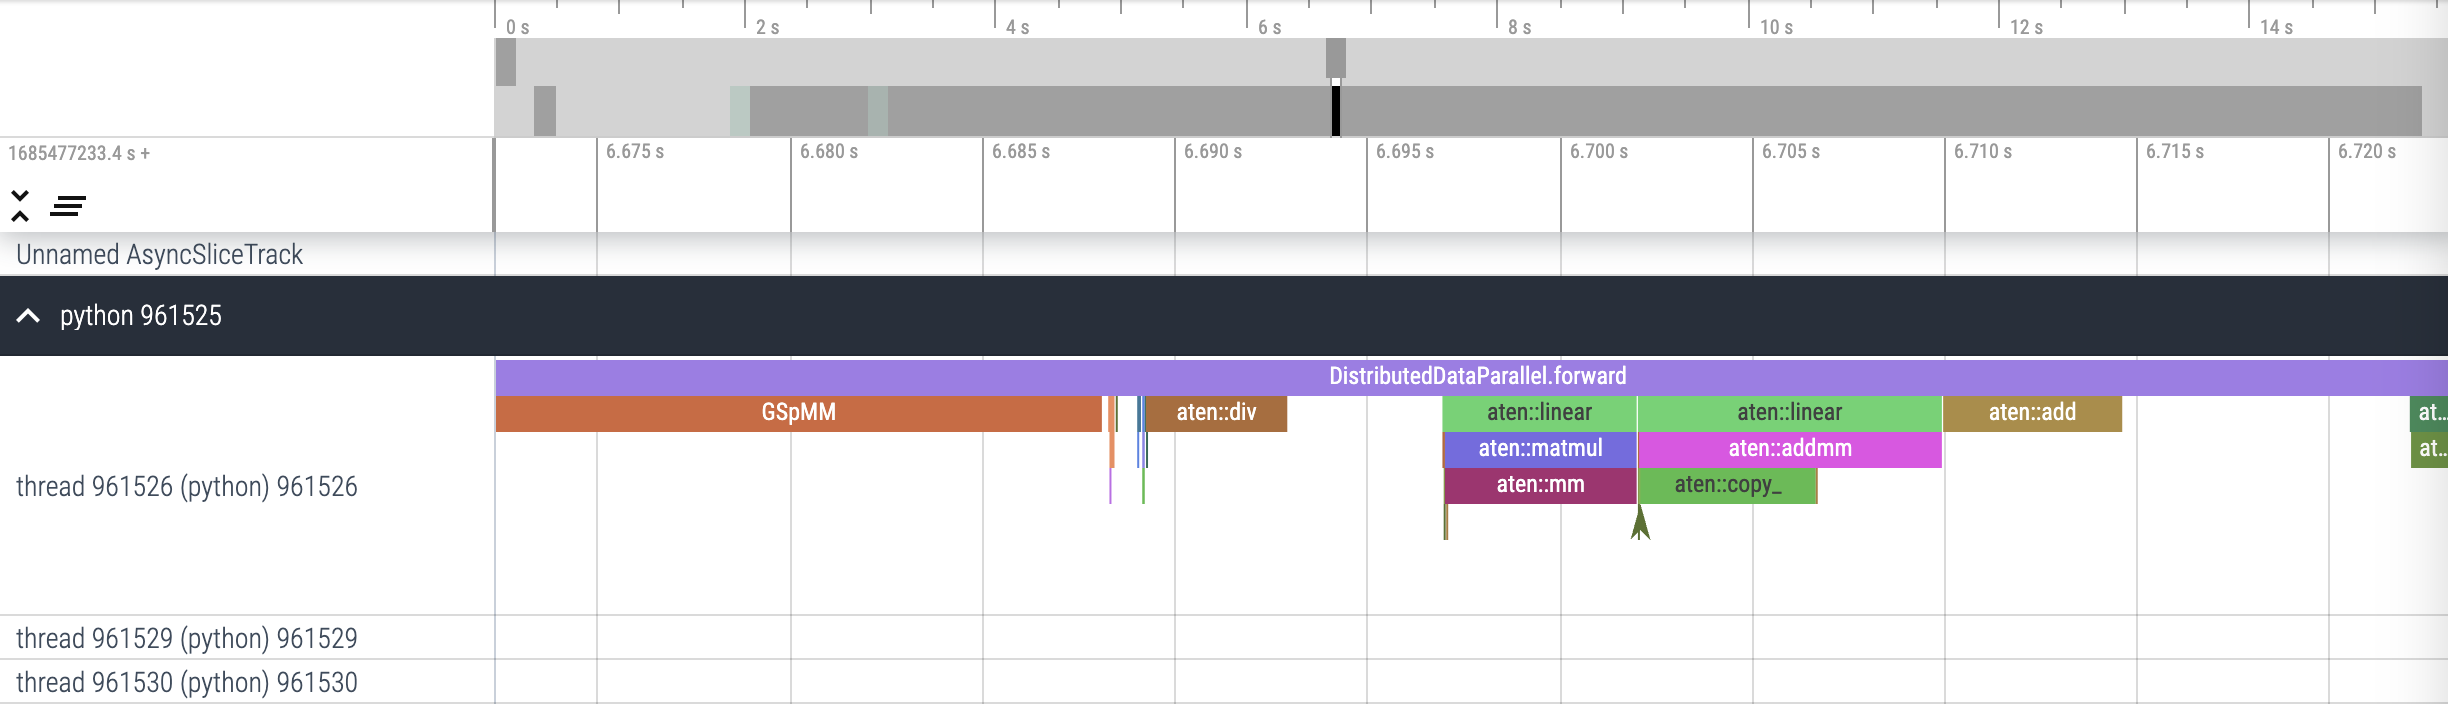
I found that there are many gaps in the trace file, and if anyone can shed some light on why these gaps exist it would be very helpful. Thanks in advance.
For example, a large gap after the function aten::index_select, aten::div, and aten::add.