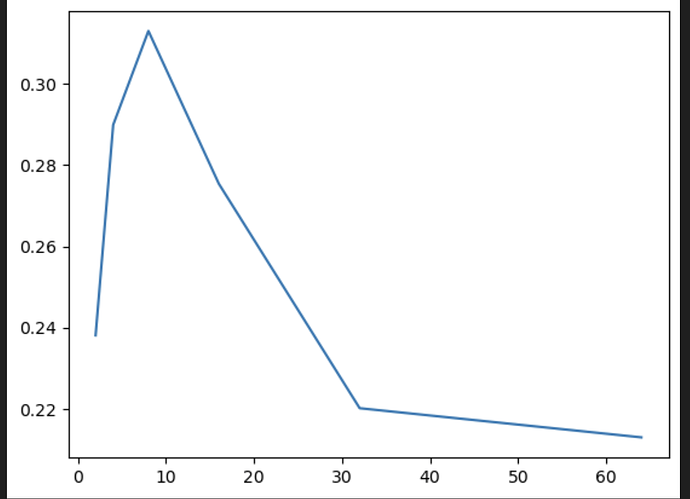
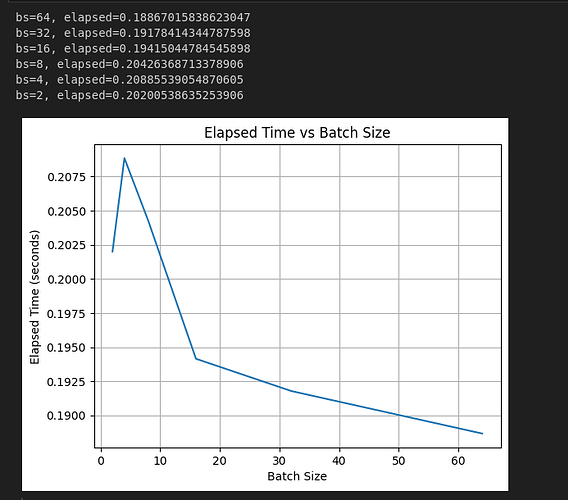
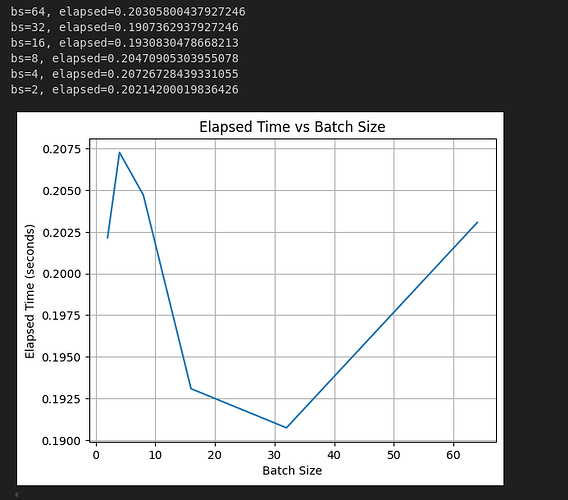
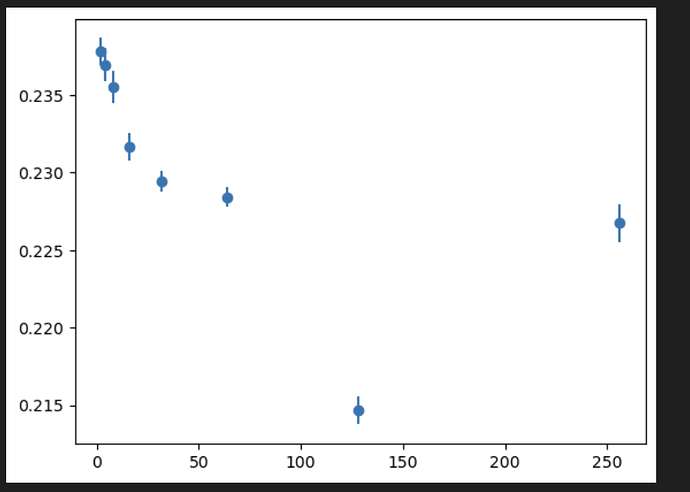
I am performing a simple matrix multiplication via pytorch/cuda on a 16 GB GPU. I am doing this multiple times until i cover 1024 samples.
when I increase the batch size, the overall time to execute does not decrease. Here is the code to reproduce
import time
import torch

n = 768
weight = torch.randn(768, n, dtype=torch.float32, device='cuda')


results = []
bss = [64, 32, 16, 8, 4, 2]
for bs in bss:
    q = torch.empty(bs, 1024, 768, dtype=torch.float32, device='cuda')
    torch.cuda.synchronize()
    start = time.time()
    torch.cuda.synchronize()
    with torch.no_grad():
        for i in range(0, 1024, bs):
            a = (q @ weight)
    torch.cuda.synchronize()
    end = time.time()
    elapsed = end - start
    results.append(elapsed)
    print(f'bs={bs}, elapsed={elapsed}')
This is the output
bs=64, elapsed=0.2129044532775879
bs=32, elapsed=0.2200911045074463
bs=16, elapsed=0.2754323482513428
bs=8, elapsed=0.31310248374938965
bs=4, elapsed=0.289961576461792
bs=2, elapsed=0.23805022239685059
I would have thought that the the execution time should roughly halve each time we double the batch size.
I also try with different matrix sizes
# at n = 64
bs=256, elapsed=0.029320716857910156
bs=128, elapsed=0.02939009666442871
bs=64, elapsed=0.02989816665649414
bs=32, elapsed=0.03046727180480957
bs=16, elapsed=0.0326845645904541
bs=8, elapsed=0.03428316116333008
bs=4, elapsed=0.036544084548950195
bs=2, elapsed=0.03979301452636719


at n = 16384
bs=64, elapsed=5.368429660797119
bs=32, elapsed=4.477093935012817
bs=16, elapsed=4.486705780029297
bs=8, elapsed=7.2721076011657715
bs=4, elapsed=7.306727170944214
bs=2, elapsed=7.336323261260986
I thought matrix multiplication was like, the perfect example of an operation which should benefit from larger batch sizes.
Here is my nvidia-smi
+---------------------------------------------------------------------------------------+
| NVIDIA-SMI 535.183.01             Driver Version: 535.183.01   CUDA Version: 12.2     |
|-----------------------------------------+----------------------+----------------------+
| GPU  Name                 Persistence-M | Bus-Id        Disp.A | Volatile Uncorr. ECC |
| Fan  Temp   Perf          Pwr:Usage/Cap |         Memory-Usage | GPU-Util  Compute M. |
|                                         |                      |               MIG M. |
|=========================================+======================+======================|
|   0  Tesla T4                       On  | 00000000:00:1E.0 Off |                    0 |
| N/A   34C    P0              33W /  70W |      2MiB / 15360MiB |      0%      Default |
|                                         |                      |                  N/A |
+-----------------------------------------+----------------------+----------------------+

+---------------------------------------------------------------------------------------+
| Processes:                                                                            |
|  GPU   GI   CI        PID   Type   Process name                            GPU Memory |
|        ID   ID                                                             Usage      |
|=======================================================================================|
|  No running processes found                                                           |
+---------------------------------------------------------------------------------------+
Perhaps my profiling is just wrong, I would love to know what is going on here.


