I was looking into the performance numbers in the PyTorch Dashboard - the peak memory footprint stats caught my attention.
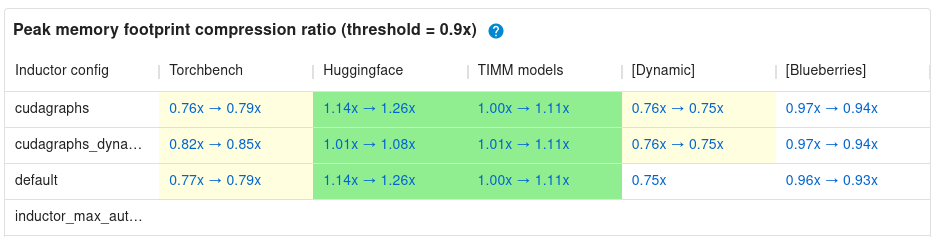
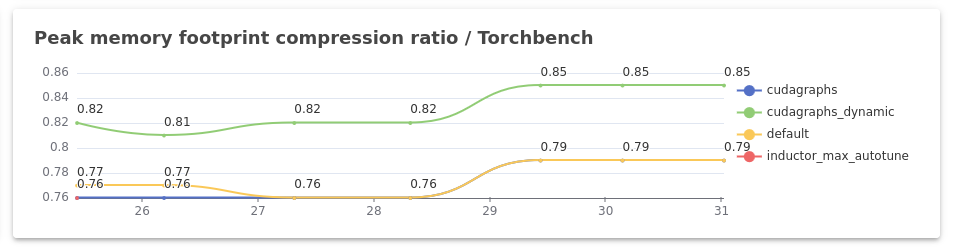
The plots:
I assume the following:
defaultin the above plots, refers totorch.compile(mode="default")cudagraphsrefers totorch.compile(mode="reduce-overhead")cudagraphs_dynamicrefers totorch.compile(mode="reduce-overhead", dynamic=True)inductor_max_autotunerefers totorch.compile(mode="max-autotune")
In the PyTorch CUDA Graph Trees podcast, it is mentioned that CUDA Graphs tend to bloat memory. (It is the general trend I guess, CUDA Graphs are known to bloat memory usage - statically allocated memory blocks, memory pools and others, and the CUDA Graph data structure itself occupies memory)
I don’t know whether I am interpreting the above plots correctly, but it seems that using CUDA Graphs reduces memory usage:
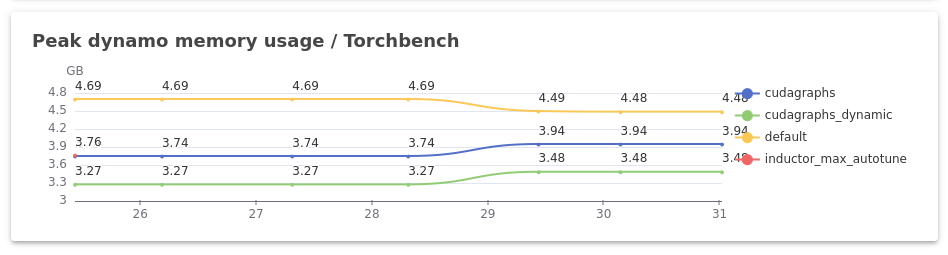
- From the “Peak dynamo memory usage” plot, it seems that,
defaulttakes up the most memory (the yellow curve), followed bycudagraphs(the dark blue curve) andcudagraphs_dynamictaking the least (the light green curve) in case of TorchBench.
Am I reading the plots correctly? If so, what is causing this reduction in memory usage? (It seems a bit counterintuitive to me.)
Also, I tried to run the huggingface.py benchmark locally:
./benchmarks/dynamo/huggingface.py --performance --training --amp --backend=inductor --output=huggingface_training.csv
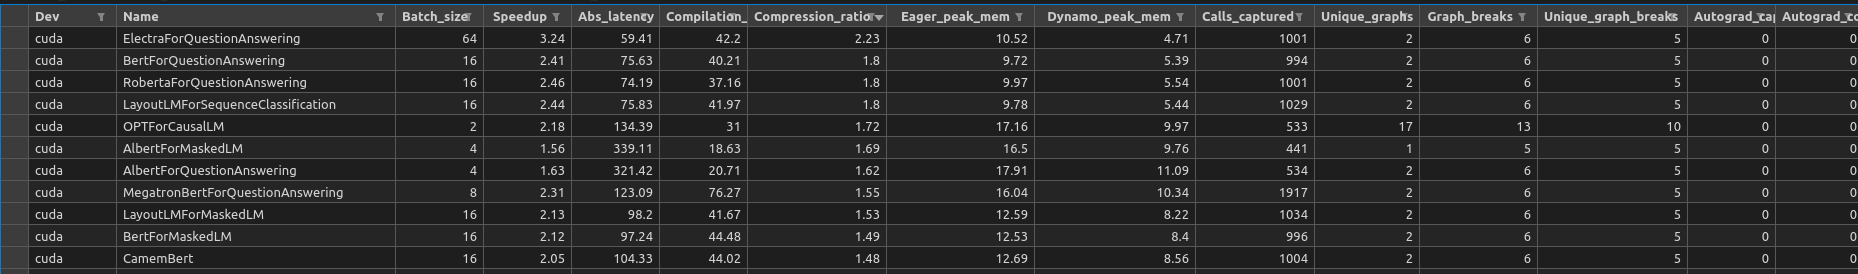
Eager Mode in the above table I guess refers to the execution of the PyTorch Program without using torch.compile.
The above table shows some good compression ratios of the peak memory usage - between Eager Mode and Dynamo. What is the reason for this compression?

Yet again, there are certain models in the local execution, where the compression ratio is
<1. What is the reason for that?