Hi everyone,
I have a question regarding the memory profiling results of ResNet.
I followed the tutorial from the PyTorch blog. The main difference in my case is that I profiled the memory usage during the inference step, rather than training.
I profiled the model-building process and 4 iterations of inference.
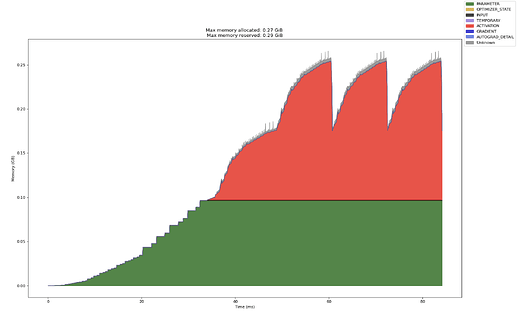
Below is a snapshot of the memory usage visualization.
My question is: why does the memory footprint of the first iteration (inference) appear significantly smaller compared to subsequent iterations?
Below is my full code for reference.
# (c) Meta Platforms, Inc. and affiliates.
import logging
import socket
from datetime import datetime, timedelta

import torch

from torch.autograd.profiler import record_function
from torchvision import models

logging.basicConfig(
    format="%(levelname)s:%(asctime)s %(message)s",
    level=logging.INFO,
    datefmt="%Y-%m-%d %H:%M:%S",
)

logger: logging.Logger = logging.getLogger(__name__)
logger.setLevel(level=logging.INFO)

TIME_FORMAT_STR: str = "%b_%d_%H_%M_%S"

def trace_handler(prof: torch.profiler.profile):
    # Prefix for file names.
    host_name = socket.gethostname()
    timestamp = datetime.now().strftime(TIME_FORMAT_STR)
    file_prefix = f"{host_name}_{timestamp}"

    # Construct the trace file.
    prof.export_chrome_trace(f"{file_prefix}.json.gz")

    # Construct the memory timeline file.
    prof.export_memory_timeline(f"{file_prefix}.html", device="cuda:0")

def run_resnet50(num_iters=4, device="cuda:0"):
    with torch.profiler.profile(
        activities=[
        torch.profiler.ProfilerActivity.CPU,
        torch.profiler.ProfilerActivity.CUDA,
        ],
        record_shapes=True,
        profile_memory=True,
        with_stack=True,
        on_trace_ready=trace_handler,
        with_modules=True,
    ) as prof:
        with record_function("## Prepare ##"):
            model = models.resnet50().to(device=device)
            inputs = torch.randn(1, 3, 224, 224, device=device)
            model.eval()
        for _ in range(num_iters):
            with record_function("## forward ##"):
                pred = model(inputs)

if __name__ == "__main__":
    # Warm up
    run_resnet50()
    # Run the resnet50 model
    run_resnet50()
Thanks in advance!
