Hi,
I have built a VAE model dealing with tabular oceanographical data. My question is, what shall I do to
visualize model weight and clarify the covariance relationship between input variables, as shown in the following chart, with tensorboard or weights and biases.
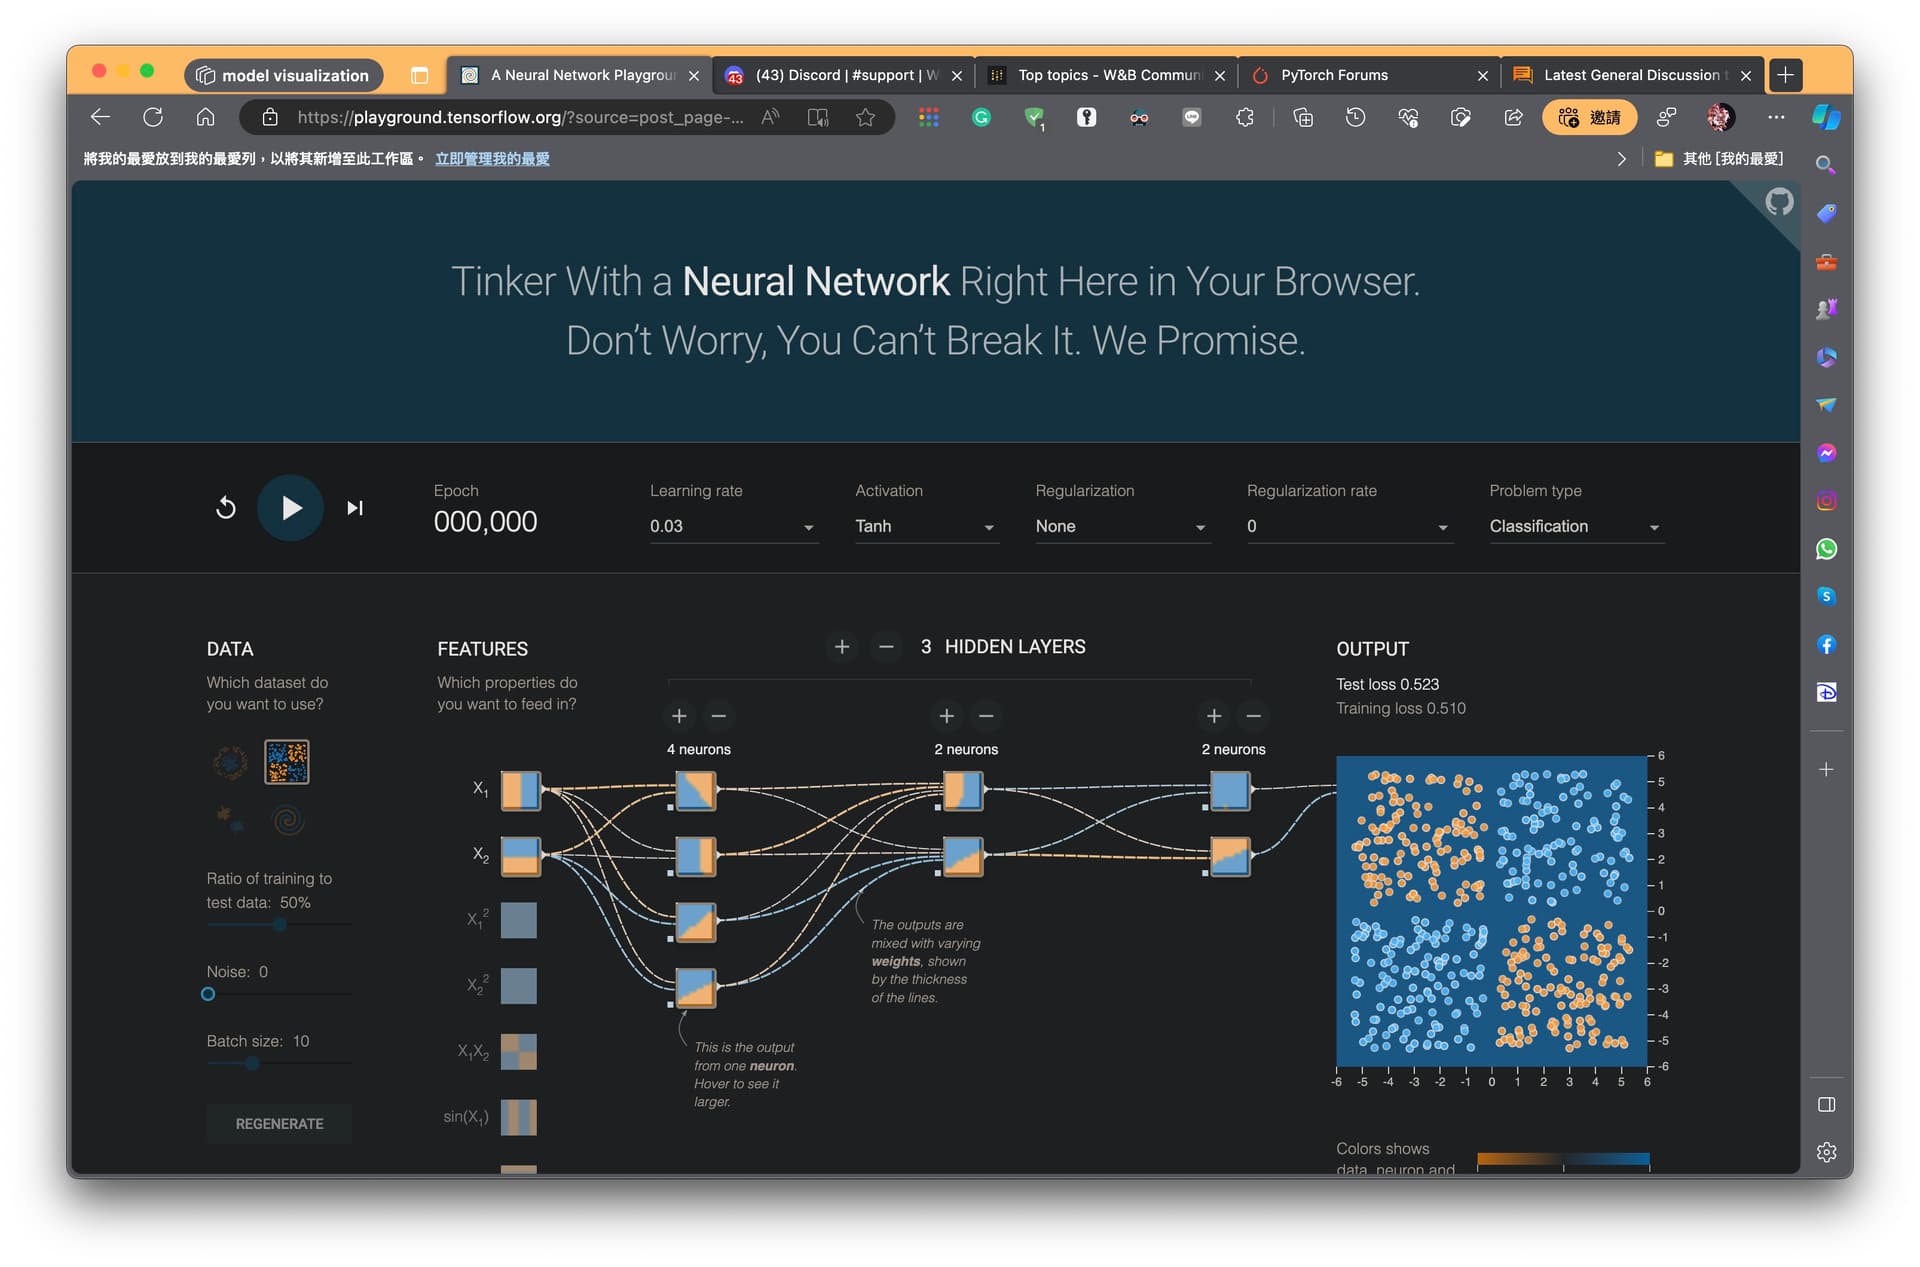
Here is the website of the screenshot.
Please note that I don’t need it to be dynamic; I only need to visualize the final model.
Sincerely,