I succeeded to build a linear regression neural network with 1 inputs and 1 outputs.
I am building a linear regression neural network with 5 inputs and 1 outputs now.
Here is the formula: y = 3e + d^2 + 9c + 11b^6 + a + 19
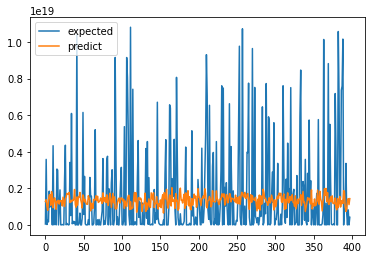
However, no matter how many neurons, epochs and hidden layers I use, I cannot predict the a good result. The predicted outputs are always within a small range. However, there are large variance among the expected outputs.
I guess it may be because of the choice of activation function, loss function and optimizer. If not, multiple input neural network may need alternative method to build.
I was successful to done it with keras but I don’t know why it is so difficult to predict the same formula in PyTorch
Here is my code:
import torch
import torch.nn as nn #neural network model
import pandas as pd
import numpy as np
import matplotlib.pyplot as plt
import torch.nn.functional as F
from torch.autograd import Variable
from sklearn.preprocessing import MinMaxScaler
from pickle import dump
#Load datasets
dataset = pd.read_csv('testB_2000.csv')
X = dataset.iloc[:, :-1].values
Y = dataset.iloc[:, -1:].values
X_scaler = MinMaxScaler()
Y_scaler = MinMaxScaler()
print(X_scaler.fit(X))
print(Y_scaler.fit(Y))
X = X_scaler.transform(X)
Y = Y_scaler.transform(Y)
#save the scaler
dump(X_scaler, open('X_scaler.pkl', 'wb'))
dump(Y_scaler, open('Y_scaler.pkl', 'wb'))
train = int((len(dataset)+1)*0.8)
test = train + 1
print(train)
print(test)
x_temp_train = X[:train]
y_temp_train = Y[:train]
x_temp_test = X[test:]
y_temp_test = Y[test:]
X_train = torch.FloatTensor(x_temp_train)
Y_train = torch.FloatTensor(y_temp_train)
X_test = torch.FloatTensor(x_temp_test)
Y_test = torch.FloatTensor(y_temp_test)
#------------------2 hidden Layers------------------------------
D_in = 5 # D_in is input features
H = 2 # H is hidden dimension
H2 = 2
D_out = 1 # D_out is output features.
#Define a Artifical Neural Network model
class Net(nn.Module):
def __init__(self, D_in, H, H2, D_out):
super(Net, self).__init__()
self.linear1 = nn.Linear(D_in, H)
self.linear2 = nn.Linear(H, H2)
self.linear3 = nn.Linear(H2, D_out)
def forward(self, x):
#activation function should be used here e.g: hidden = F.relu(...)
h_relu = self.linear1(x) #min=0 is like ReLU
middle = self.linear2(h_relu)
prediction = self.linear3(middle)
return prediction
model = Net(D_in, H, H2, D_out)
#Define a Loss function and optimizer
criterion = torch.nn.MSELoss()
optimizer = torch.optim.SGD(model.parameters(), lr=0.2) #2e-7, lr=learning rate=0.2
#Training model
inputs = Variable(X_train)
outputs = Variable(Y_train)
inputs_val = Variable(X_test)
outputs_val = Variable(Y_test)
loss_values = []
val_values = []
epoch = []
epoch_value=50
for i in range(epoch_value):
for phase in ['train', 'val']:
if phase == 'train':
#print('train loss')
model.train() # Set model to training mode
prediction = model(inputs)
loss = criterion(prediction, outputs)
#print(loss)
loss_values.append(loss.item())
optimizer.zero_grad() #zero the parameter gradients
epoch.append(i)
loss.backward() #compute gradients(dloss/dx)
optimizer.step() #updates the parameters
elif phase == 'val':
#print('validation loss')
model.eval() # Set model to evaluate mode
prediction_val = model(inputs_val)
loss_val = criterion(prediction_val, outputs_val)
#print(loss_val)
val_values.append(loss_val.item())
optimizer.zero_grad() #zero the parameter gradients
torch.save(model.state_dict(), 'formula2.pth') #save model
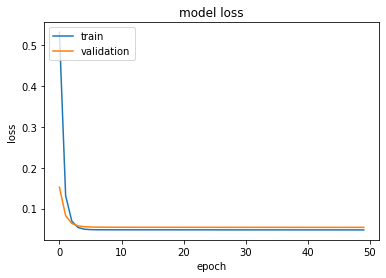
#Plot train_loss vs validation loss
plt.plot(epoch,loss_values)
plt.plot(epoch, val_values)
plt.title('model loss')
plt.ylabel('loss')
plt.xlabel('epoch')
plt.legend(['train','validation'], loc='upper left')
plt.show()
#plot prediciton vs expected value
prediction_val = prediction_val.detach().numpy()
prediction_val = Y_scaler.inverse_transform(prediction_val)
#print('predict')
#print(prediction_val)
Y_test = Y_scaler.inverse_transform(Y_test)
#print('test')
#print(Y_test)
plt.plot(Y_test)
plt.plot(prediction_val)
plt.legend(['expected','predict'], loc='upper left')
plt.show()
Thanks for your time!