Hey, I’m using a single node with 4 T4 GPUs and getting
gpu074:31329:31756 [3] include/alloc.h:48 NCCL WARN Cuda failure 'out of memory'
gpu074:31329:31756 [3] NCCL INFO bootstrap.cc:231 -> 1

gpu074:31329:31756 [3] bootstrap.cc:279 NCCL WARN [Rem Allocator] Allocation failed (segment 0, fd 58)
at random times but after multiple hours into training. I think it happens on rank 0 GPU but not sure. I have tried different GPUs. I’m internally reporting memory usage via torch.cuda and I’m seeing a consistent memory usage throughout the run, for example,
Device 1, local 1 ->  memory_allocated 1.4130144119262695GB  max 8.116474151611328GB  memory_reserved 10.359375GB,  max 10.359375GB

Device 0, local 0 ->  memory_allocated 1.4130144119262695GB  max 8.116474151611328GB  memory_reserved 10.359375GB,  max 10.359375GB
torch_version is 1.10.2+cu102. The code worked with DP so it is an issue I have introduced by moving to DDP.
When I changed the way I was reporting evaluation values using all_reduce by cloning the variable then deleting it after the reduce seemed to extend the lengths of runs I get (generally fails in the middle of the third epoch instead of the middle of the second)? Are there memory management issues with DDP that I am not aware of? Is there a better way of reporting memory usage? I don’t have access to nvidia-smi on the server I use during training. Or maybe there is a debugging strategy that I could use?
Hello, NCCL is specific to DDP and not DP so it makes sense you aren’t hitting this NCCL error when using DP. Since you mentioned this is happening on the rank 0 GPU, I am thinking it could be that all other processes are unintentionally using cuda:0 and creating cuda context on that device which is causing OOM errors there. You could try setting CUDA_VISIBLE_DEVICES on each process to explicitly specify the device it should operate on. See https://developer.nvidia.com/blog/cuda-pro-tip-control-gpu-visibility-cuda_visible_devices/ for more details.
Ideally if we could get a code snippet or access nvidia-smi on the server to look at the memory allocation that would be helpful!
Thanks for the help. I can include my sbatch and worker scripts easy enough, model/training code is harder. It’s a modified version of Transformer-XL though. I only have one process since it is a single node, and as such all 4 gpus should be visible correct? Would a cuda context not show up when reporting torch.cuda. memory_allocated or memory_reserved? because those are consistent across GPUs and the same values thoughout training.
sbatch script
#!/bin/bash
#SBATCH --job-name=DS-CE
#SBATCH --ntasks=1
#SBATCH --nodes=1
#SBATCH --mincpus=16
#SBATCH --gres=gpu:4
#SBATCH --mem=32G
#SBATCH --partition=t4v2
#SBATCH --qos=high


ln -sfn /checkpoint/"${USER}"/deepsoftmax"${SLURM_JOB_ID}" /h/arvie/experiments/deepsoftmax
touch /checkpoint/${USER}/${SLURM_JOB_ID}/DELAYPURGE
echo $(pwd)

export LD_LIBRARY_PATH=/pkgs/cuda-9.2/lib64:/pkgs/cudnn-9.2-v7.3.1/lib64:$LD_LIBRARY_PATH

. /h/"${USER}"/PycharmProjects/Virtualenv/pytorch_recent/bin/activate

# these commands don't need to run for all workers, put them here
MAIN_HOST=`hostname -s`
# this is the current host
export MASTER_ADDR=$MAIN_HOST
# pick a random available port
export MASTER_PORT="$(python -c 'import socket; s=socket.socket(); s.bind(("", 0)); print(s.getsockname()[1])')"

export OMP_NUM_THREADS=4

export TORCH_DISTRIBUTED_DEBUG=DETAIL
# export NCCL_DEBUG_SUBSYS=ALL
export NCCL_DEBUG=INFO
# This is needed to avoid NCCL to use ifiniband, which the cluster does not have
export NCCL_IB_DISABLE=1
# This is to tell NCCL to use bond interface for network communication
if [[ "${SLURM_JOB_PARTITION}" == "t4v2" ]] || \
    [[ "${SLURM_JOB_PARTITION}" == "rtx6000" ]]; then
    echo export NCCL_SOCKET_IFNAME=bond0 on ${SLURM_JOB_PARTITION}
    export NCCL_SOCKET_IFNAME=bond0
fi

# this will execute "number of tasks" times in parallel, each with
# slightly different env variables for DDP training
/opt/slurm/bin/srun --mem=32G bash -c "experiments/ce_small/ce_worker.sh $*"
The problem seems to have resolved itself by updating torch, cuda, and cudnn. nvidia-smi never showed an increase in memory before getting the OOM error. At this point, I’m thinking it is a memory leak somewhere.
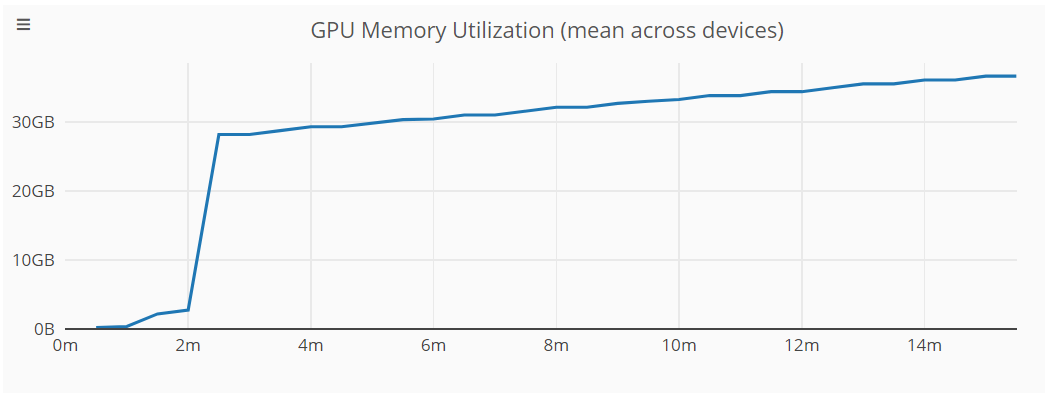
Hi, which CUDA version are you using right now? I’m facing the same Issue - 2 to 8 GPUs - the picture beneath represents a training using 8 A100 GPUs. Memory leak even after a few minutes into training.
A minimal executable snippet would include a dataloader, the model, the setup and a trainer class. This is a rather large example then and would require some time. I can directly message you and link you to my project, explain what happens and show you the related lines. If you prefer an executable snippet, i will do it in the next few weeks. Unfortunately i have a lot other things todo first.
group = dist.new_group(list([i for i in range(self.num_gpus)]))
dist.all_reduce(loss, op=dist.ReduceOp.SUM, group=group)
dist.all_reduce(acc, op=dist.ReduceOp.SUM, group=group)
In the validation loop, i called new_group every time which caused the leak (obviously).
Create the group once at self or leave it default was the solution
Oh i need to edit that as well. The “leak” also occurred there but much smaller - i only used 2 GPUs and trained only for 10 epochs. Due to rounding, it looked like it did not appear but it did as well.
Thanks. That solves my problem. I also got a NCCL error (with WARN: OOM). I finally found the error was due to the consumption of memory of rank 0 by other processes.