I’m training a GAN on a computing cluster with pytorch lightning and I’m trying to investigate what’s causing some bottlenecks with a profiler. As you can see, one_hot() is taking a very long time, with each call averaging 0.03 seconds:
Here is the relevant code, sampling a conditional probability distribution from the generator:
    def sample_G(self, n) -> Tuple[Tensor, Tensor]:
        """
        Generates n generator samples. In this conditional GAN case we're sampling G with a uniform class label prior.

        @param n: Number of samples
        @return: Tensor of generator samples
        """
        z = self.sample_z(n)
        y = tr.floor(tr.rand(n, device=next(self.G.parameters()).device) * 10).long()
        y_one_hot = F.one_hot(y, num_classes=10).float()

        return self.G(z, y_one_hot)
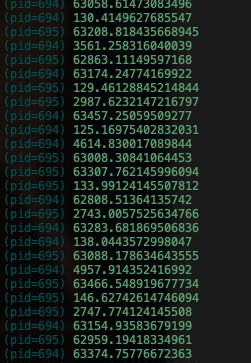
Getting between 100-6000 us per call. It looks like some calls are taking really long and others are not.
Also I’m on pytorch 1.7.1
Here’s the code again:
def sample_G(self, n) -> Tuple[Tensor, Tensor]:
    """
    Generates n generator samples. In this conditional GAN case we're sampling G with a uniform class label prior.

    @param n: Number of samples
    @return: Tensor of generator samples
    """
    z = self.sample_z(n)
    y = tr.floor(tr.rand(n, device=next(self.G.parameters()).device) * 10).long()
    t0 = time.time()
    y_one_hot = F.one_hot(y, num_classes=10).float()
    t1 = time.time()
    print(t1 - t0)

    return self.G(z, y_one_hot)