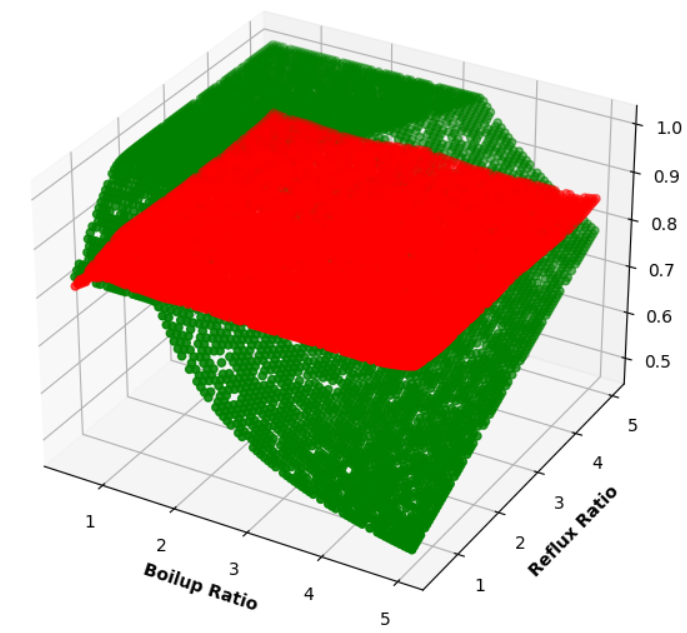
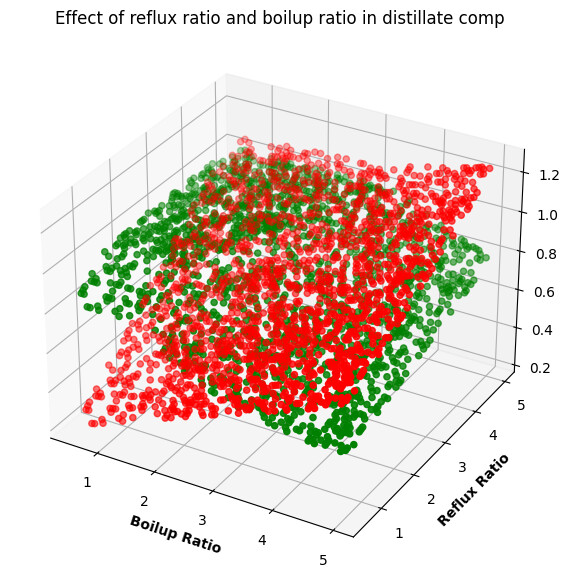
Hello, everyone. I am programming a neural network to predict benzene composition in distillate stream (1 output) according to reflux and boilup ratio (2 inputs) but the predict values are in a flat while the real behavior is not linear. I tried to use just one input to verify the NN performance in this case and the data fitted well, however when I set one property (for example reflux ratio = 2 for all boilup ratios), I obtained the behavior of straight line, unlike the real non linear behavior. Anyone has already faced this? Below, there is the picture with the predictions (red) and real values (green) and the model of my neural network (code)… I will be very grateful if someone can help me…
x = self.layer1(x)
x = F.relu(x)
x = self.layer2(x)
x = F.relu(x)
x = self.layer3(x)
x = F.relu(x)
x = self.layer4(x)
x = F.relu(x)
x = self.layer5(x)
x = F.relu(x)
x = self.layer6(x)
Could you please provide some metrics: How many epochs of training, loss curve trend, accuracy, etc. It could be because the model still hasn’t done enough learning.
Yes, I’ve tried nn.ReLU() but I obtained the same behavior…
If it is better, here is my code: Google Colab
And here the data that I am using: Ex1_Cab.xlsx - Google Sheets
(There are 4 models of NN but I am using just the Model1 and predict just the first output of the spreadsheet - Fracd_Bz)
I will be very grateful, if you have some contribution
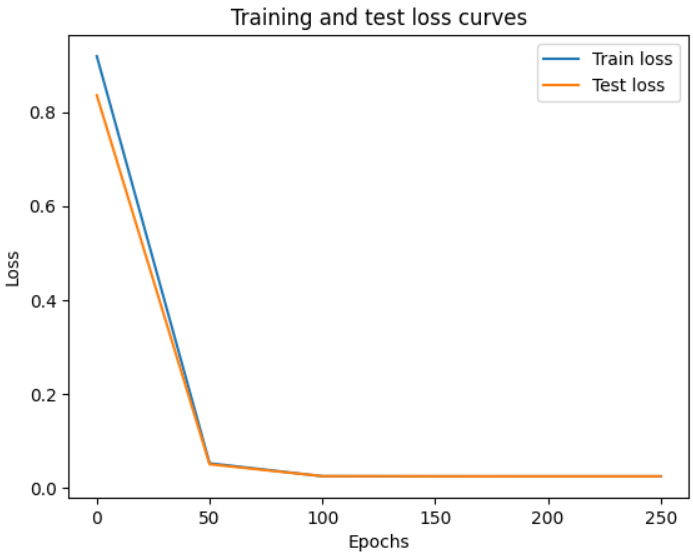
I used 300 epoches and the loss curve trend is below… If it is better to understand what I did, here is my code: Google Colab and the data that I am using: Ex1_Cab.xlsx - Google Sheets. I will be very grateful, if you have some contribution…
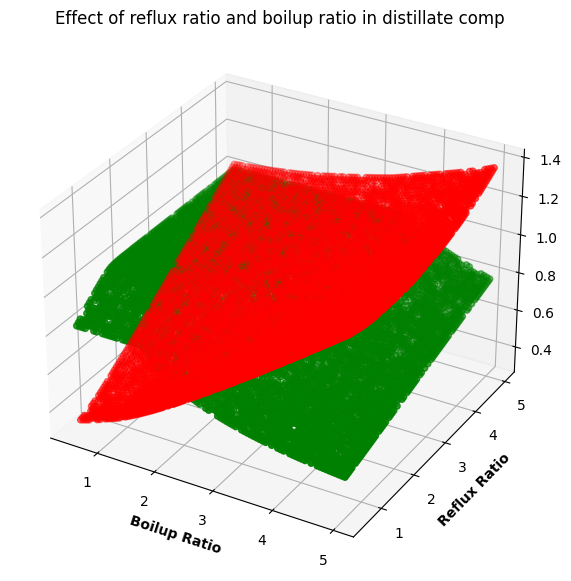
I trained for 30 epochs and i got a more non-linear graph. I think this can just be an issue of overfitting. Your model stops learning by the 50th epoch.
Edit:
You seem to be giving your entire training set in one pass. Try breaking it into batches, and try a lighter model.
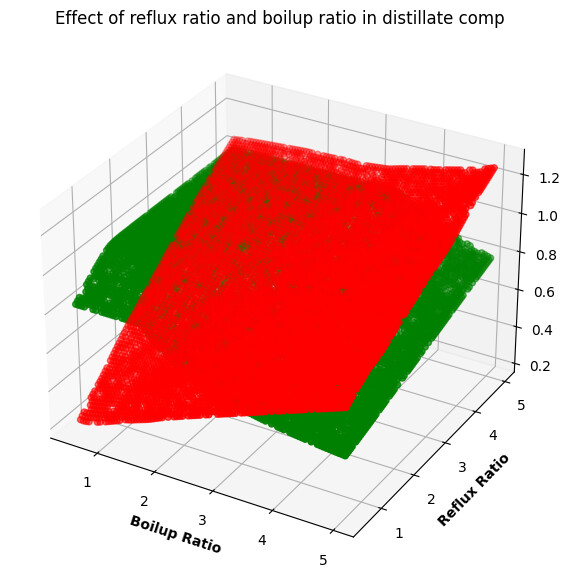
For example, i broke the dataset into 96 batches of size 69, and i trained with the same parameters you used and the curve is as follows:
Model:
  class Model1(nn.Module):
      def __init__(self):
         super().__init__()

         self.layer1 = nn.Linear(in_features=2,out_features=64)
         self.layer2 = nn.Linear(in_features=64,out_features=1)
         self.activation_function = nn.ReLU()

      def forward(self,x):

         x = self.activation_function(self.layer1(x))
         x = self.layer2(x)
         return x