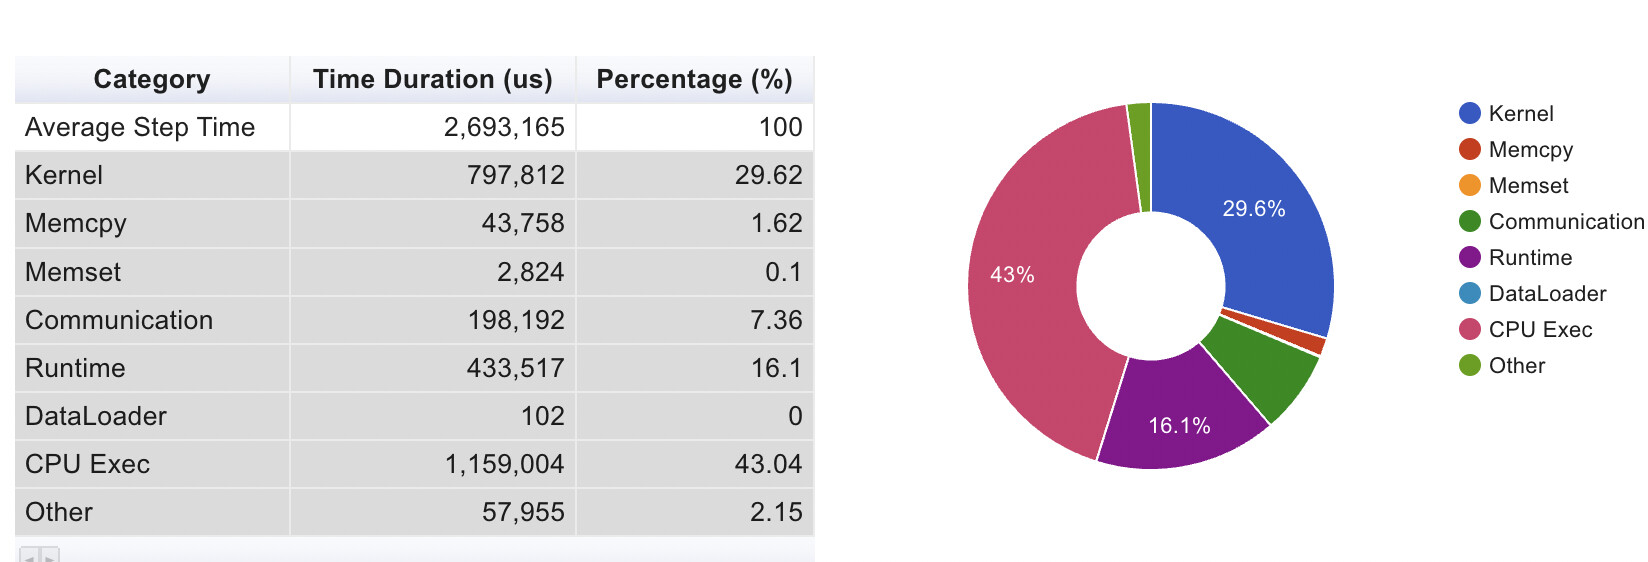
Here you can see Computation/Communication Overview and Synchronizing/Communication Overview. What does “other” represent in the left plot? Why could the sync times in the right be so high? Or maybe that’s normal?
And here the overview for a single node, notice the high cpu relative to kernel usage:
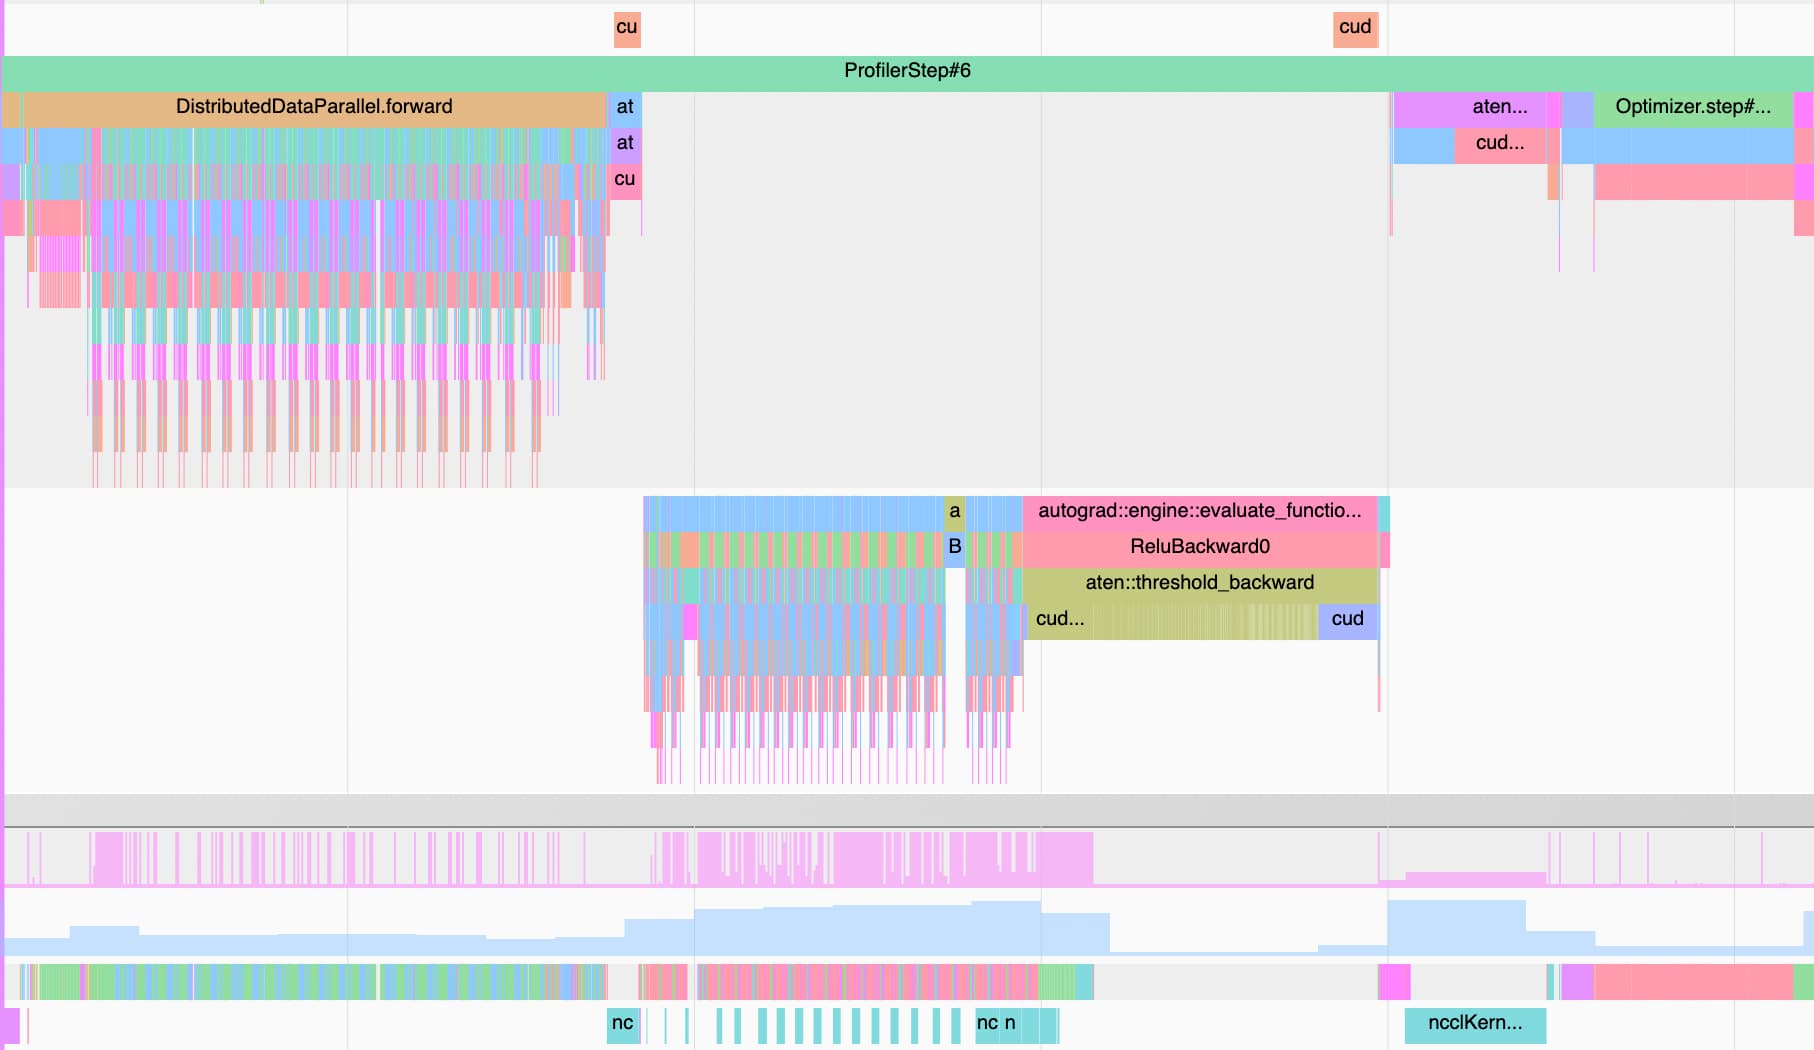
Most of the GPU kernel time is apparently spent on all_reduce. What’s weird is the backward pass has decent util, but the forward pass does not. Maybe that’s because of the all_reduce happening simultaneously? You can see that here:
Notice the loooong ReluBackward! There are apparently a lot of cudaFrees happening then (everything underneath in the green), why could that be? And why does allreduce have to wait for the cudaFree’s to happen?
If one has a complicated network with many operations is it unavoidable that a lot of time is going to be spent on CPU stuff?
Would be very grateful for pointers about what’s going on. The main thing that concerns me is the high amount of “other” in first image, the low GPU util in the forward pass and whether there is a solution other than fusing operations by writing kernels, and the relubackward cudafree stuff.
I’m not familiar enough with the native PyTorch profiler and don’t know how to properly interpret the results, but would recommend to also profile your code with Nsight Systems to see if the actual kernel execution is slow (I doubt relu is that slow) or is the launch is blocked by e.g. synchronizing cudaFree calls. The same applies for the NCCL calls. E.g. if one rank is slower than the rest the NCCL communication kernels might show a long execution time, but are just waiting for the slowest node in fact and are thus spinning.
You can also add stacktraces to Nsight Systems which would allow you to hover over each kernel to see which method calls it.
Have a look at this post for an example.
1 Like
okay i’ll give nsys a go!
one thing more thing id like to ask, i thought pytorch/tensorflow used memorypool’s to avoid doing cudamallocs and cudafree’s during training, is that not the case? seems like an obvious way to get a speed up?
That is the case and you should not see any cudaFree/cdaMalloc calls after the warmup iterations unless you are running into an OOM error and PyTorch tries to free the cache before reallocating memory or if you have explicitly disabled the caching allocator.
2 Likes
I see. In my case the batch size and length change every epoch, could this be caused by cuda benchmarking?
I don’t know what you mean by “cuda benchmarking”, but PyTorch won’t change the batch size or sequence length of the input for you.
1 Like
Sorry that was not clear at all from me.
I mean this: torch.backends — PyTorch 1.13 documentation
and I mean could the cudaFree etc. be caused because the tensor dims are changing which is causing different kernels to maybe be called
Ah, yes cudnn.benchmark = True will profile each new workload (e.g. when the input shape changes), which could call algorithms needing an internal workspace.
To avoid wasting memory, the cache is cleared afterwards as seen here.
1 Like