I have a flask (python) server, serving pytorch models as API.
With each request allocated GPU memory grows and eventually I get “Out of Memory”.
As far as I can tell, there shouldn’t be anything in my code holding any references to models/tensors, and everything should be initialized from scratch for each request, but I’m sure I’m wrong, just don’t know how to debug: what is holding reference to these tensors?
I filtered out the tensors on GPU:
    import gc
    objs = gc.get_objects()
    gpu_tensors = [obj for obj in objs if isinstance(obj, torch.Tensor) and obj.is_cuda]
I can get objects referring to these tensors using gc.get_referrers(t) – most of them are referenced by three: “<class ‘list’>”, “<class ‘list’>”, “<class ‘collections.OrderedDict’>” (and few by 72 – probably suspicious?)
But I don’t know how to figure out what is this “list” in my code? Why variable is holding it so I can delete/release it?
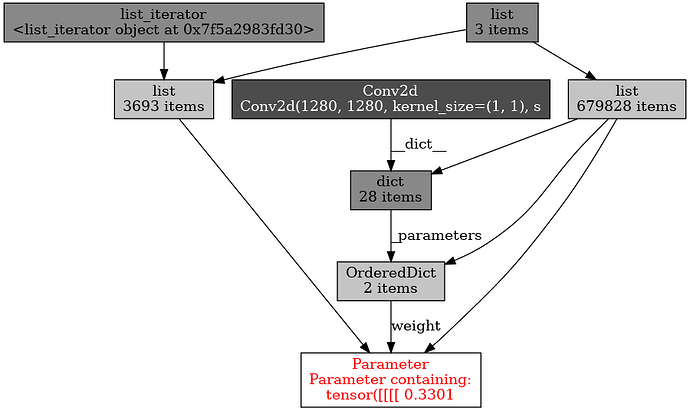
I also tried to visualize using objgraph, and get nice graphs, like this one for one of those tensors:
But the same problem – where in my code is this “list” or “list_iterator”?
I would be grateful for any tips on how to learn to debug this issue.
