Nsight profile shows many pthread_cond_wait during the first 20 iterations

Hi ! I have tried to profile the inference runtime of my model by looping the inference for 100 iterations (100 test samples).

However, I have come to notice the multiple pthread_cond_wait that shows during the first 20 (out of 100) iterations. My questions are:

  • What could have caused the problem? I used only Pytorch and Pytorch Geometry package.

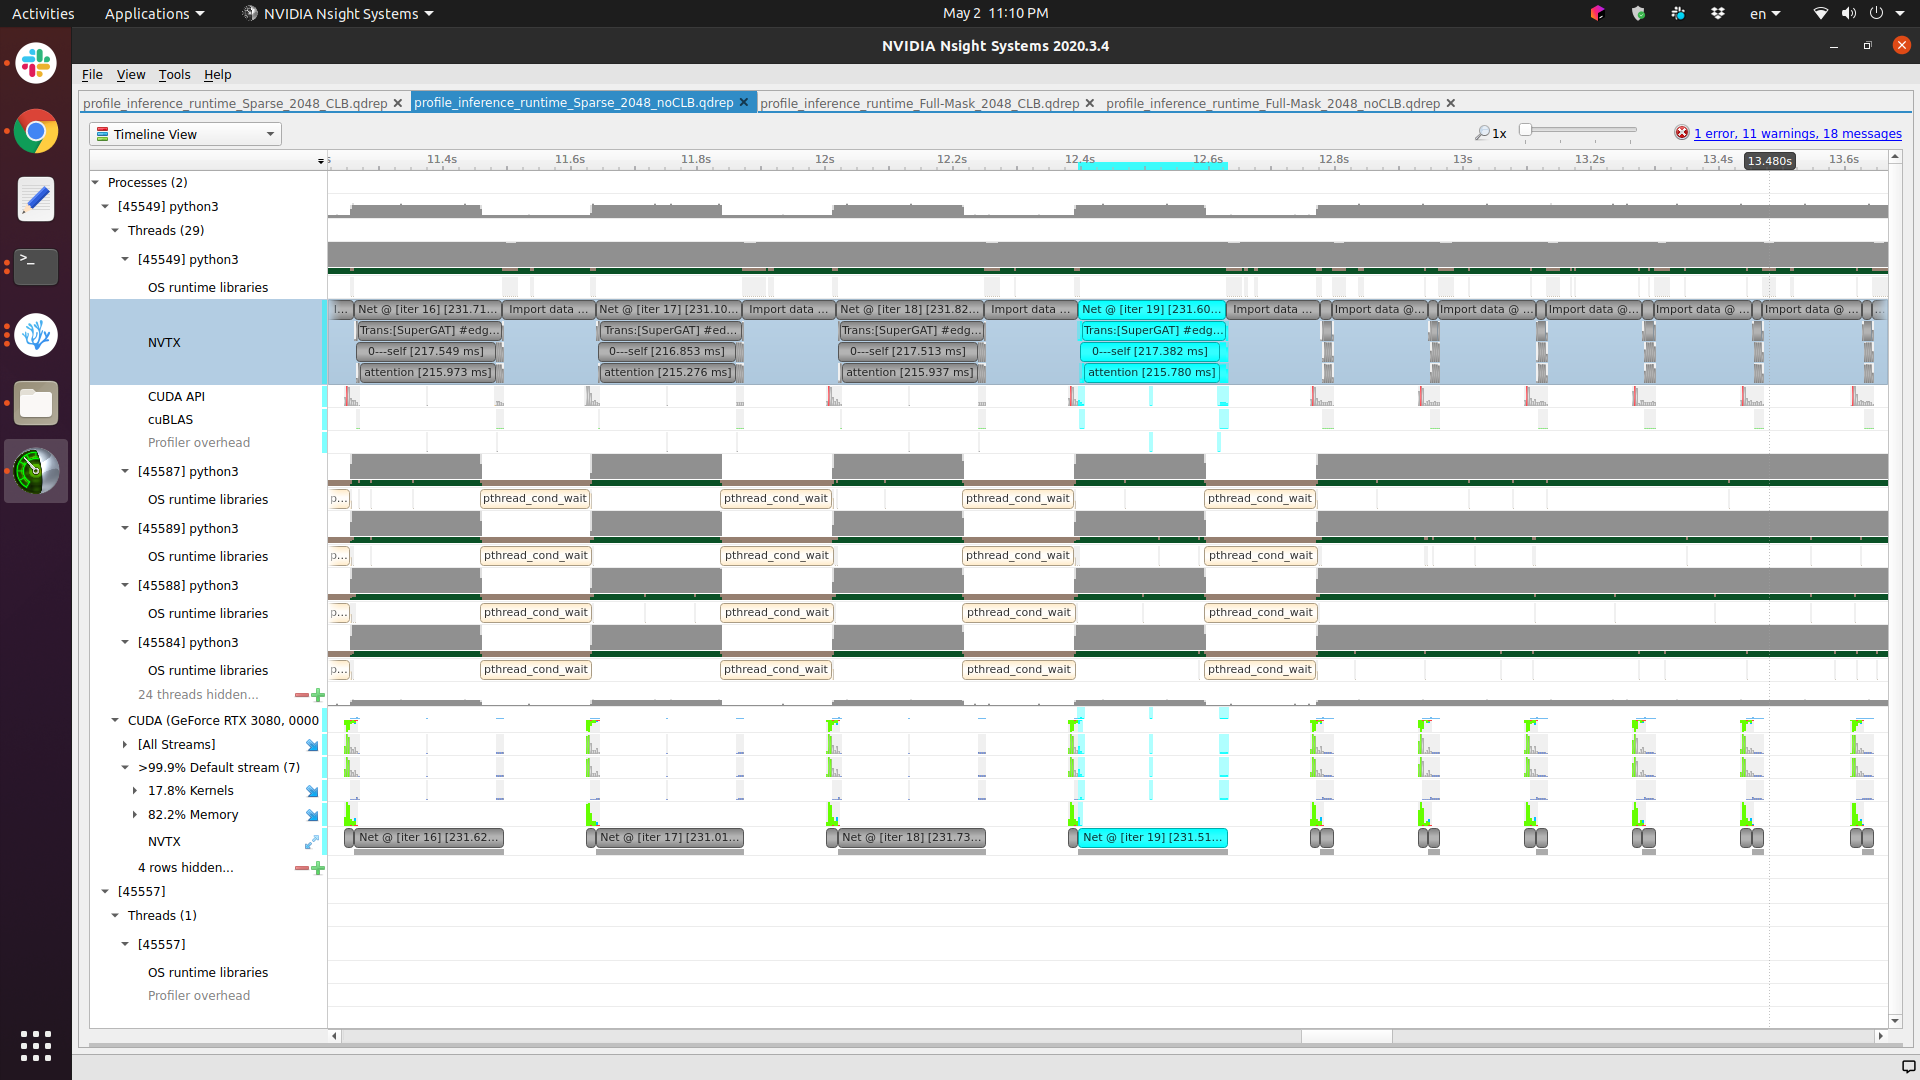
  • After 20 iterations, the pthread_cond_wait has disappear, should I trust the runtime after those 20 iterations?

Here I also provide the following captured screen to show my problem.
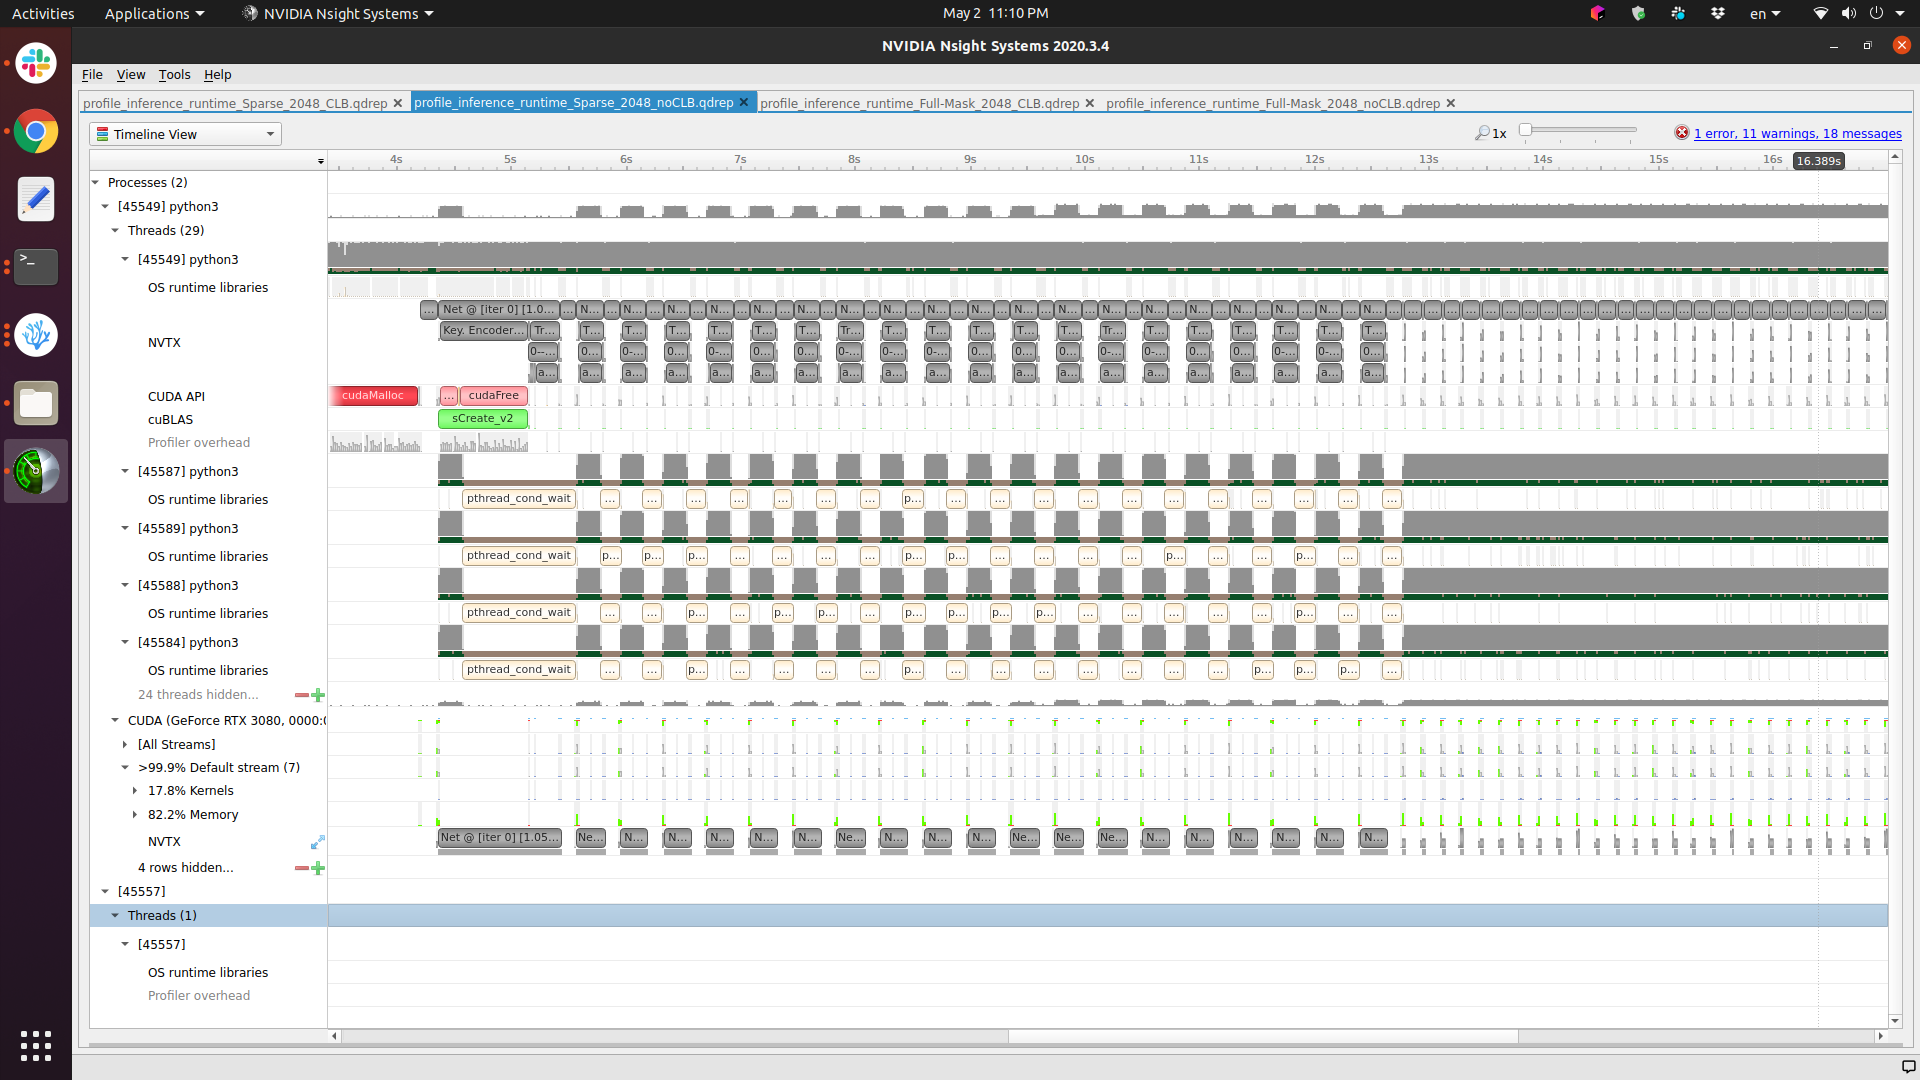
(Zoom in)

It is a TorchScript model? I found that the model is really slow during first ~10 iterations due to some optimisation passes. For my sequence model this was unacceptable as I was passing multiple different lengths, where each new length seemed to be causing optimisation to run.

Can you try:

with torch.jit.optimized_execution(False):
  # call your model here.
1 Like

That solves the problem! Thank you !!! …

However, what does it means for torch.jit.optimized_execution(False) ?