Hello, I have faced a problem with num_workers while training my models. I have made a simple transfer learning task with densenet121 and CIFAR10 resized to the ImageNet resolution of 224:
Transform and the data loader are defined as follows:
# transform
transform = transforms.Compose([transforms.Resize((224, 224)),
                                transforms.ToTensor()])

# define the training data loader
training_loader = DataLoader(dataset=cifar_dataset, batch_size=64, shuffle=True, pin_memory=True, num_workers=8)
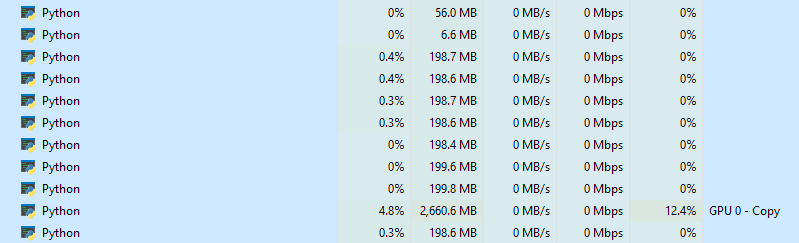
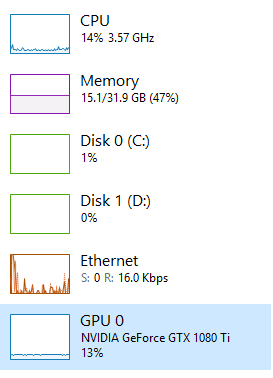
So, I use 8 workers on the host to feed the data to the device. The model works just fine, however, I have noticed that not all workers do something (in fact, all 8 don’t seem to do anything), while the main thread is the one that loads the data (loads up to 10% though):
Given that your disk usage is very low, your workers seems to have very little to do anyway.
It’s weird that both cpu and GPU usage are very low (and steady). Do you work with very small net/inputs?
Hi, I built a simple transfer learning task and the network I am using is the DenseNet121 which is not pretrained. Also I use the CIFAR10 which is resized to the resolution of the ImageNet (224, 224) in the data loader. I assumed that was enough complexity to test out the num_workers in the dataloader.
i think that looks fine, the task is so easy (CIFAR is so incredibly small) that it doesn’t even really utilize the one CPU. I don’t think this creates a bigger bottleneck than spreading it across workers.
Also, the resizing op is so cheap that it is maybe too fast to draw any conclusions from that. Could you run this on a larger dataset? You could use UTKFace or CACD or sth that is simple to download. Or, you could simply resize the CIFAR images and save them in higher res to disk (maybe 500x500). I think the data loading of the image and reading it into the tensor would be the main task where I would suspect bottlenecks.
In any case, another thing to try (which probably doesn’t make a difference) is not to use pinned memory (btw. it always made things substantially slower than not using it; don’t necessarily expect a correlation with your issue, but maybe just a simple thing to try).
That is why I am trying to figure this whole multithreading loader question once and for all. I found out that a lot of other practitioners have the same issues but I couldn’t find a reasonable solution yet.
That is why I am trying to figure this whole multithreading loader question once and for all. I found out that a lot of other practitioners have the same issues but I couldn’t find a reasonable solution yet.
So your observation (quoted below) only applies to when the memory is pinned? What do you get when you set it to False?
Exactly same performance with pin_memory=False In fact, I have the same problem with the model we are building at work, which is a massive variational autoencoder with image resolution of 1024x1024. The setup on that machine is Threadripper 2950X and 2x TRX2080Ti.
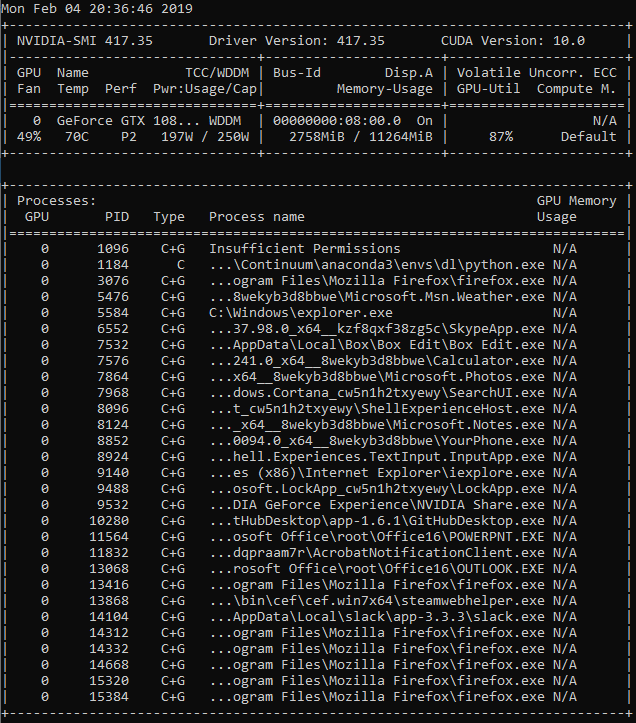
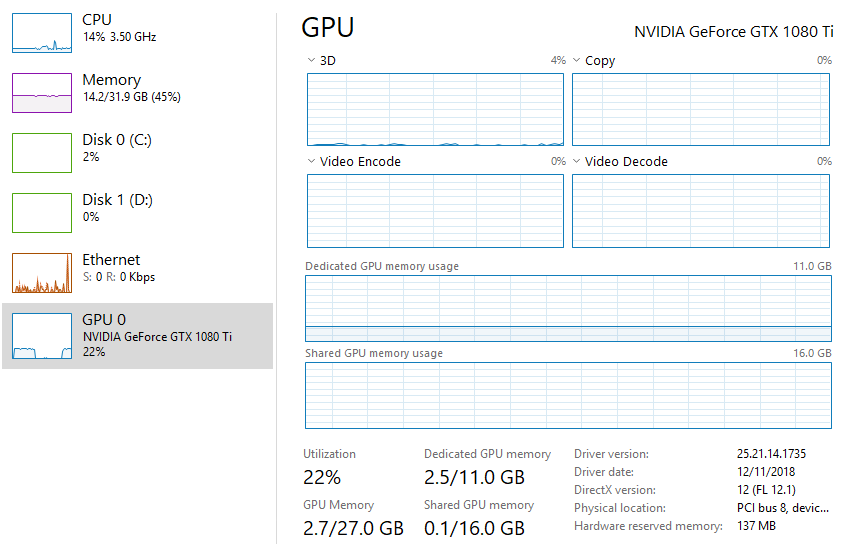
The second last row is the GPU process? I think this may look like expected then. You can see that 5 workers are doing sth but the task is not very demanding so that the remaining 3 out of 8 workers may not be really used. They all use ~200 Mb of memory, so the 3 workers may just be finished at the time you took that screenshot and are waiting for the remaining 5 to finish. The bottleneck is likely IO since you have only ~0.4% CPU usage.
The 12.4% GPU usage looks also normal maybe, because you have a very small model (2.660 Mb) and there’s probably not much to do for the GPU in terms of computation compared to other tasks that need to be performed during the forward & backward passes like updating the weights and so forth?
Another thing to do is maybe that you have too many workers and there is a communication-based bottleneck between the processes. Maybe reduce the number of workers temporarily to 1 and 2 and see if you can better GPU utilization. I usually use 2 or 4 processes max and always get like 99% utilization for relatively standard models like ResNet 34 etc.
Thank you, I will try to do that; meanwhile could you tell me an example of a network to get 99% utilization? I would like to reproduce the results on my machine.
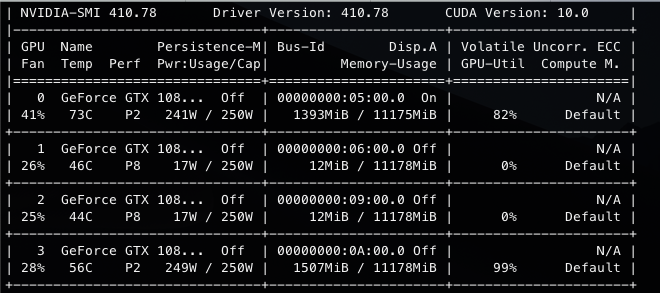
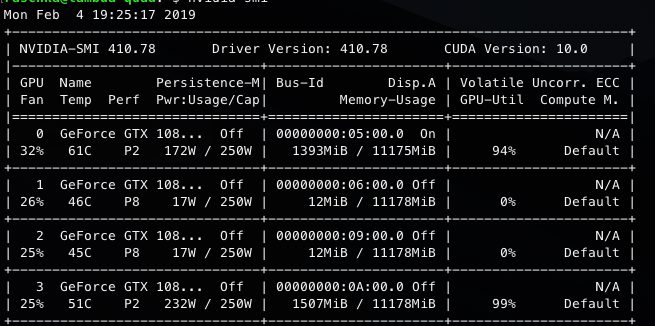
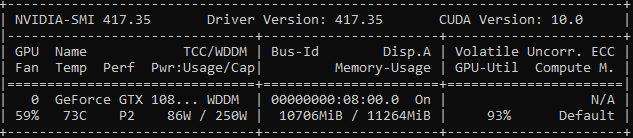
Ok great. Maybe try nvidia-smi based on the original model you were using. I think nvidia-smi is more or less accurate, because the utilization almost perfectly correlates with the fan speed, which correlates with perceived noise
Do you happen to know what are the breaks in the GPU processing? GPU doesn’t do anything for a little and then starts working again (works in cycles).
I guess updating the weight is probably not requiring much computing. Or other tasks that you may have in your network where you are copying values etc. Essentially everything that is not a large dot product or matrix multiplication.
 In fact, I have the same problem with the model we are building at work, which is a massive variational autoencoder with image resolution of 1024x1024. The setup on that machine is Threadripper 2950X and 2x TRX2080Ti.