When running multiple iterations of some PyTorch module, to understand the situation better, one can use torch.cuda.nvtx.range_push("iteration{}".format(iter)) and torch.cuda.nvtx.range_pop(), which gives a nice timing diagram on nsys as follows:
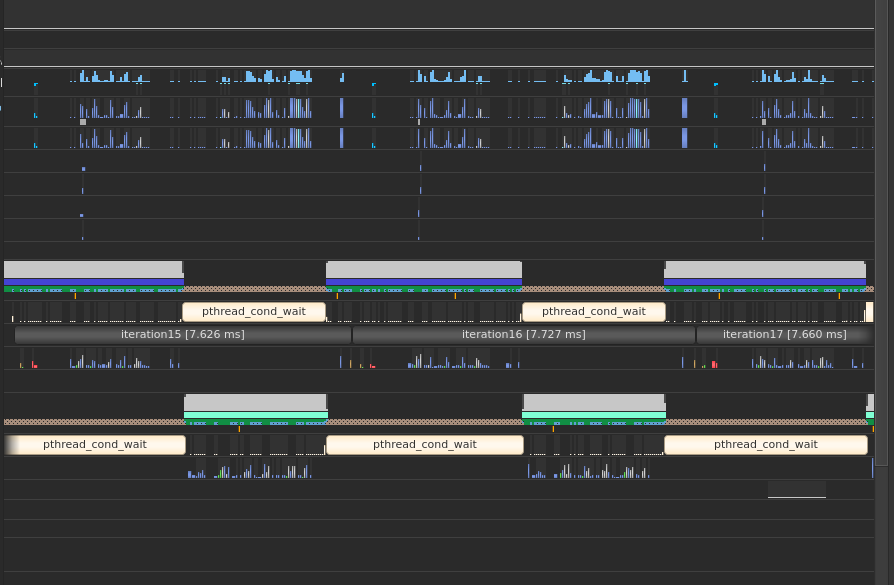
But the problem with nsys is that, it does not show the details of the stack traces (like the exact code regions with line numbers) during the run. In this situation, pytorch’s profiler comes handy.
But the problem which I am facing is, I am unable to display in the chrome://tracing the iteration level separation as in nvtx.
I tried using torch.profiler.itt.range_push and torch.profiler.itt.range_pop from the Intel Instrumentation and Tracing Technology APIs as follows:
import torch
from torchvision.models import resnet18

model = resnet18().cuda()
inputs = [torch.randn((5, 3, 224, 224), device='cuda') for _ in range(10)]

model_c = torch.compile(model, mode="reduce-overhead")

def fwd_bwd(inp):
    out = model_c(inp)
    out.sum().backward()

# warm up
for i in range(5):
    fwd_bwd(inputs[0])

print(f"{torch.profiler.itt.is_available()=}")
with torch.profiler.profile(with_stack=True) as prof:
    for i in range(1, 4):
        torch.profiler.itt.range_push(f"iteration_{i}") # like torch.cuda.nvtx.range_push()
        fwd_bwd(inputs[i])
        torch.profiler.itt.range_pop() # like torch.cuda.nvtx.range_pop()
        prof.step()

prof.export_chrome_trace("trace_torch_compile_reduce-overhead_with_itt_range_push_pop.json")
Output:
$ python3 test_pytorch_profiler_test_torch_compile.py
torch.profiler.itt.is_available()=True
STAGE:2024-05-09 19:05:18 27886:27886 ActivityProfilerController.cpp:314] Completed Stage: Warm Up
STAGE:2024-05-09 19:05:18 27886:27886 ActivityProfilerController.cpp:320] Completed Stage: Collection
STAGE:2024-05-09 19:05:18 27886:27886 ActivityProfilerController.cpp:324] Completed Stage: Post Processing
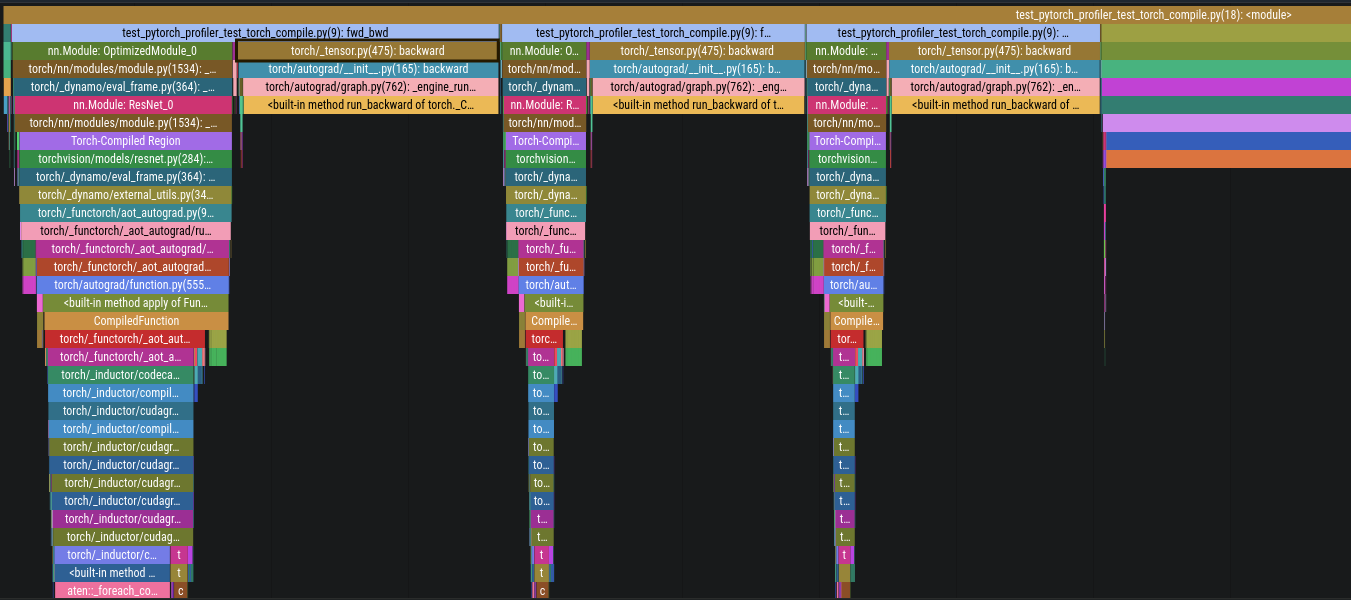
But it does not create any stack entry like the nvtx equivalent does.
I just see an entry saying that the itt.range_push api was called:
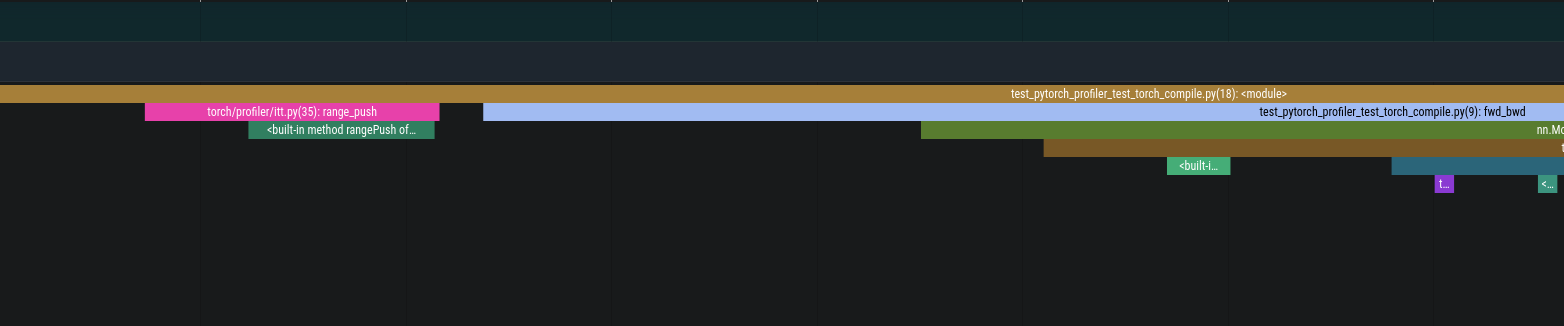
How to distinctly indicate that we are moving across different iterations.