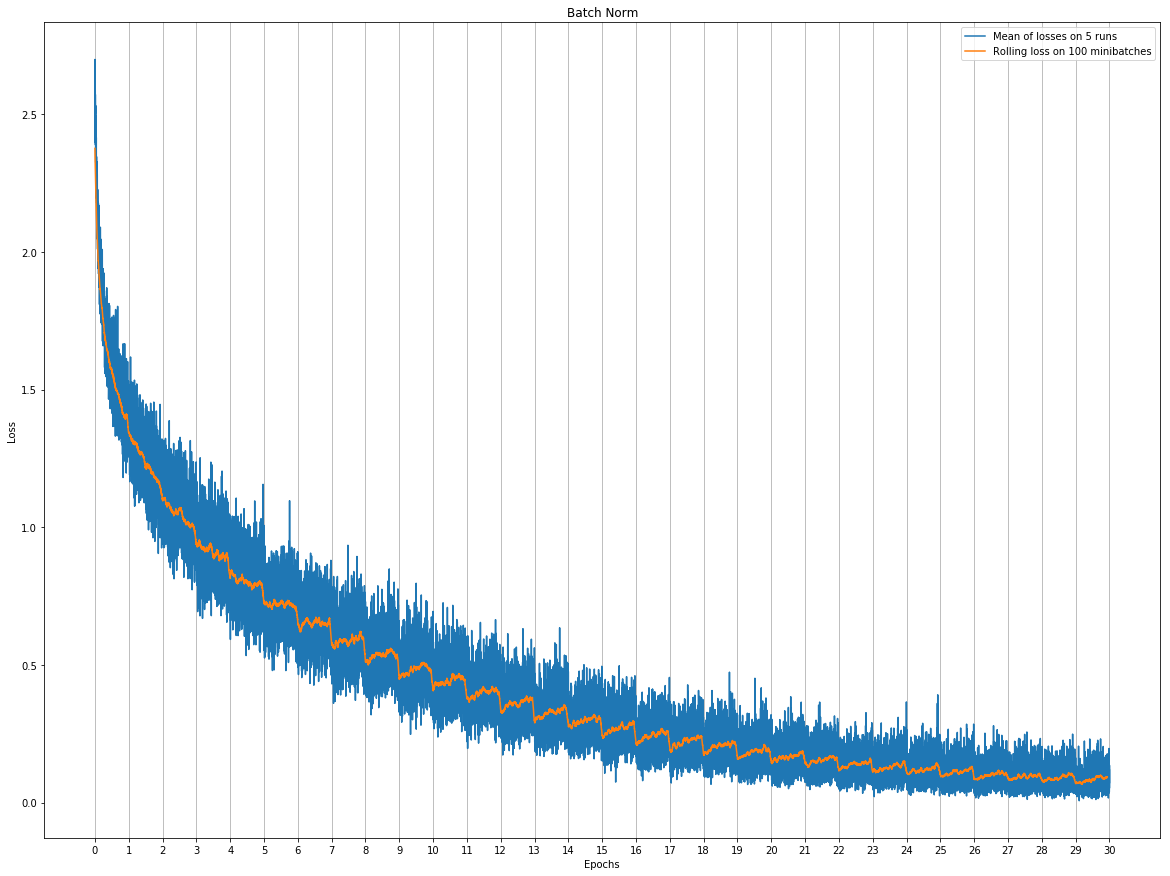
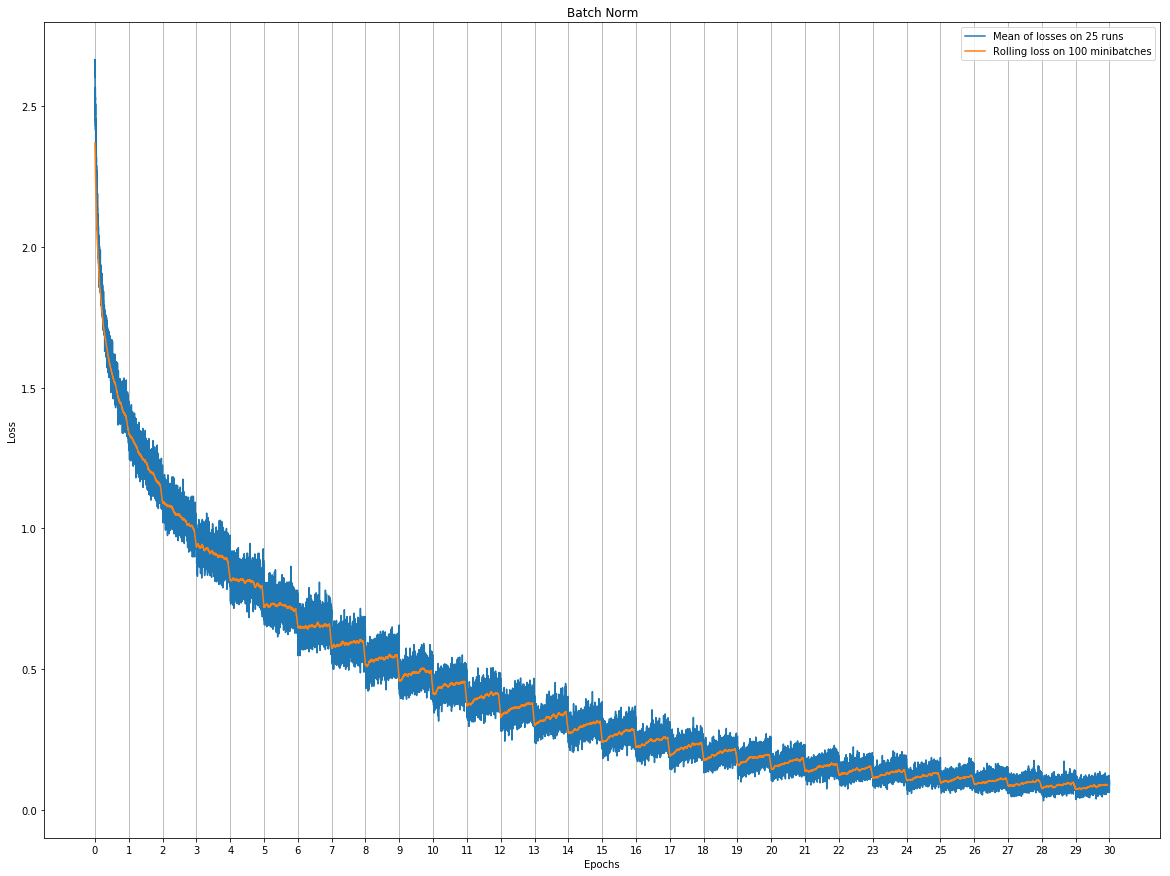
I’ve been playing around with some neural networks lately, trying to compare different kinds of normalization layers on a simple problem (namely VGG16 on the CIFAR10 dataset).
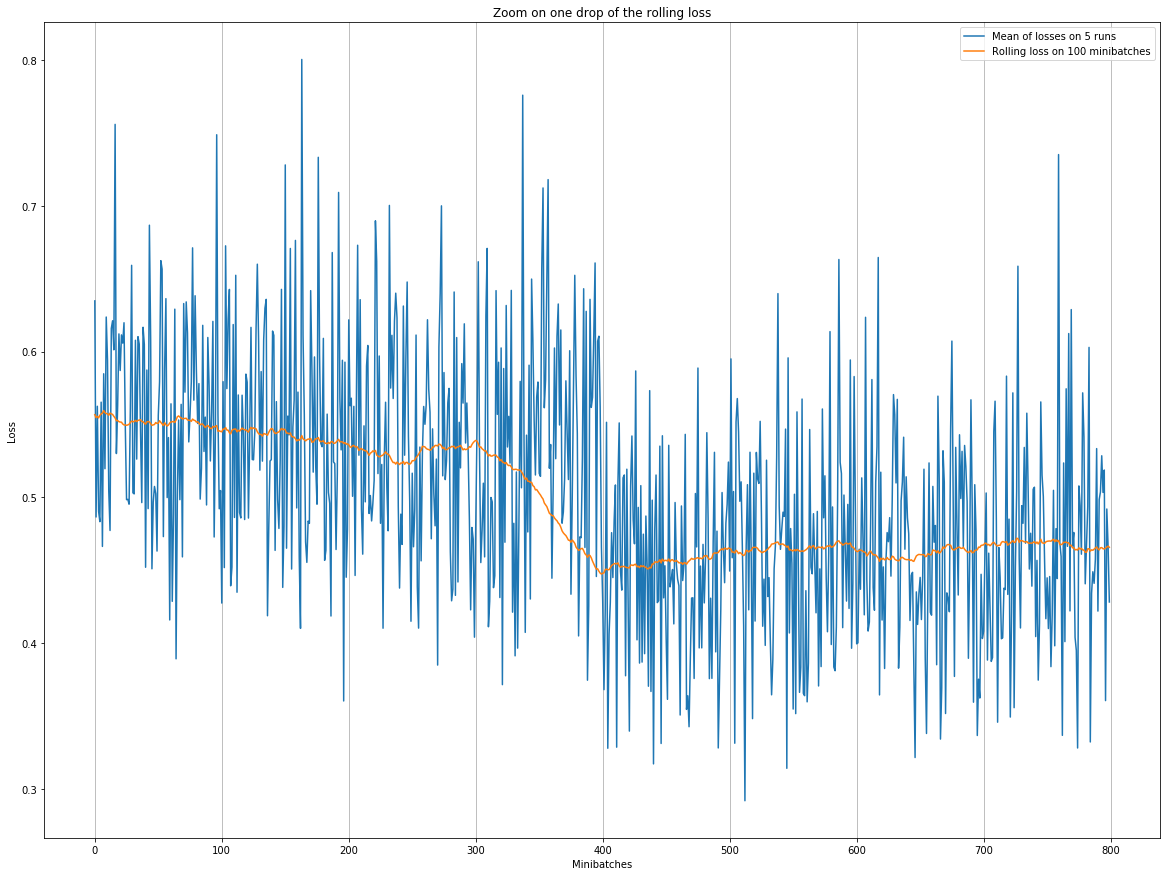
However the loss graph for only one model is really noisy, so I decided to plot a mean of the losses for 5 runs of the same architecture. Let L_it be the loss for the i-th model on the minibatch at time t, each of my point p_t is computed by the following :
I’m also plotting a rolling loss to smooth everything a bit, computed as follows :
The steps which are appearing between every epochs shouldn’t be there I guess… I talked to my teachers about it, they all agree that it isn’t normal, but none of them has been able to find the problem.
Concerning the code I use to produce those results :
I really tried to keep it as simple as possible, and it follows really closely the code provided in the Pytorch tutorial for CIFAR10.
def train_model(model, trainLoader, criterion, optimizer, epochs, gpu):
    train_losses = []
    for epoch in range(epochs):
        for i, data in enumerate(trainLoader, 0):
            inputs, labels = data[0].to(gpu), data[1].to(gpu)

            optimizer.zero_grad()
            outputs = model(inputs)
            loss = criterion(outputs, labels)
            loss.backward()
            optimizer.step()

            train_losses.append(loss.item())

            if(i%100==99):
                print("[%d, %5d] loss : %.5f" % (epoch + 1, i + 1, loss.item()))

    print("Finished training\n\n")
    return train_losses
Did I miss anything obvious? I tried to describe my problem as precisely as possible (while keeping it simple), but if you need more information please ask.
Thanks.
(PS : what’s the best way to integrate LaTeX equations in a post?)
This does look odd. I don’t see anything obviously wrong, but my
guess is that you have a gremlin hiding in your code somewhere,
and maybe it is in some part of the code you didn’t post.
But before I indulge in any idle speculation, let me point out that
there is something very fishy about your graph.
The rolling loss at time (batch iteration) t and t + 1 are related by p'_{t+1} = p'_t + (p_{t+101} - p_t) / 100. The drop in the
rolling loss in your graph at around epoch 15 is about 0.05. Therefore
the difference between p_{t+101} and p_t would have to be about
5, that is, about twice the entire height of your graph!
(Even if your rolling loss is not averaged over five runs like your mean
loss (blue) is, you can’t realistically have a delta-p of 5 get averaged
down to something like the worst case of perhaps 0.3 that could be
hiding in the envelope of your blue graph.)
I could be misinterpreting your graph, or the numbers could be off,
but either way, I can’t really conjecture much at this point.
(As a side note, as written, your formula for your rolling loss sums
over 101 values of p_i, but divides by 100 – not that this is relevant
to the issue at hand.)
My preference is not to integrate LaTex into this kind of forum.
Whether it’s some kind of embedded LaTeX (e.g., MathJax) or
an image generated from LaTeX, it’s harder to copy and paste
and to search on. (But that’s just me …)
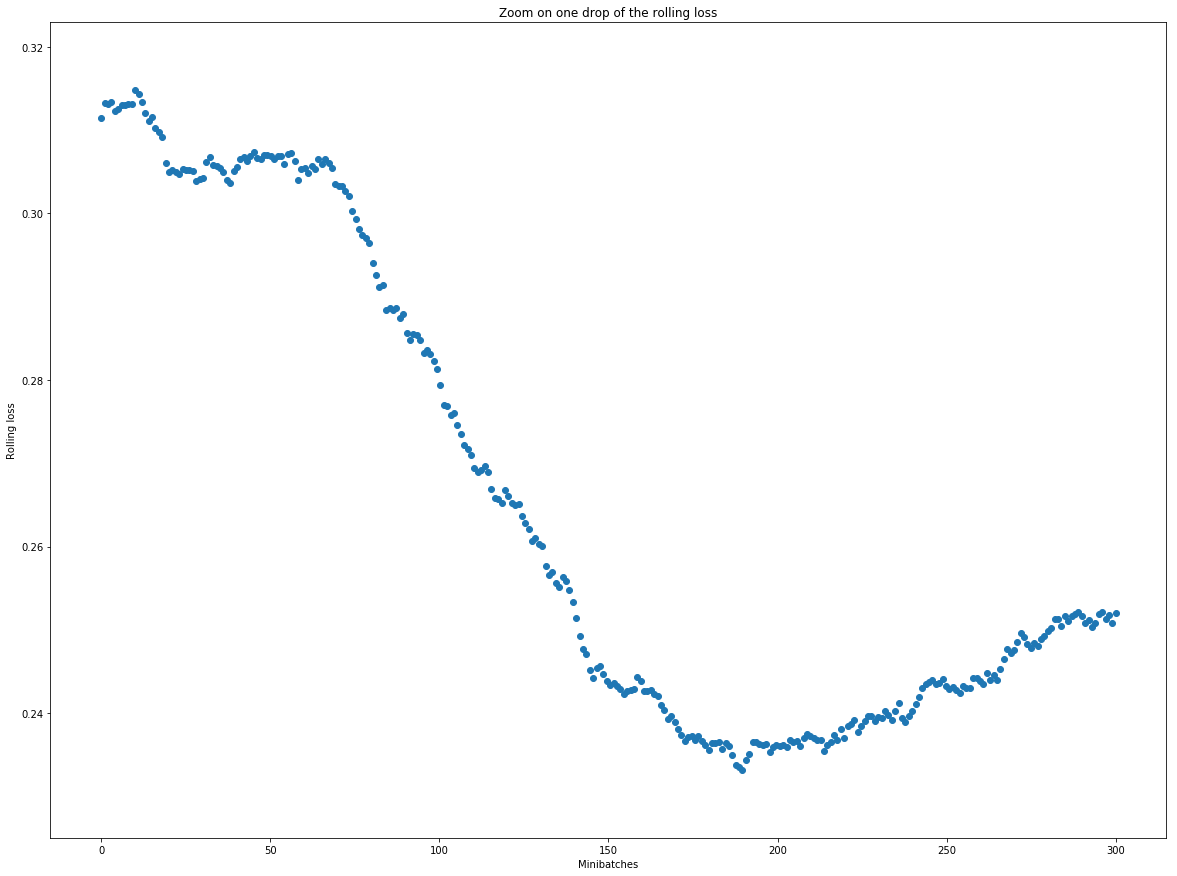
Your observation is really interesting, and I thought it would be the solution to my problem. However, I zoomed in on the graph, and the drop doesn’t occur exactly between p_t and p_{t+1}, but over the span of a hundred of batch iterations (I’ve got ~46K points in the entire graph, hence the impression of a sudden drop).
I don’t think that the rolling loss is the problem, because for me it seems that the drops are visible even in the mean loss (from the 6th epoch to the 14th for example). Just in case, this is how I compute it (train_bn being my list of averaged losses) :
rolling = [np.mean(train_bn[i:i+100]) for i in range(len(train_bn) - 100)]
Something still seems inconsistent with your graphs.
Let me explain what my concerns are. I can’t really back this
up with numbers because I can’t see the details of the blue
data in your first graph – it’s all blurred together. All I can
really see is the envelope of the blue data.
So two concerns:
In your second graph – the rolling-average loss where I can see
the individual points – over the range of about 100 batches where
the rolling loss decreases nearly steadily, it looks like the next
point is lower than the previous about 80% or 90% of the time.
This means (from my discussion in my first post) that the relevant p_{t+100} has to be lower than p_t about 80% or 90% of the
time. But the blue envelope in your first graph makes it look to me
like the p_ts are very noisy, jumping back and forth. I just can’t
imagine a realistic correlation that would cause such noisy data
to systematically satisfy p_{t+100} < p_t (over the relevant
range).
The second also has to do with the noise in the p_t that I deduce
from the blue envelope. My understanding is that the blue data
in your first graph comes from averaging over five runs. But let’s
say, just to make the point more extreme, that it’s a single run.
The spread in the data (which should be proportional to the
standard deviation) is about 0.3. Averaging over 100 such values
should reduce the spread down by a factor of sqrt (100) = 10, so
down to about 0.03.
If I look at the “noise” wiggles in the orange curve in your first
graph – that is, not the sawtooth shape that tracks the epochs,
but rather the short-time fluctuations on top of the sawtooth –
(and, similarly, at the point-to-point, non-trend fluctuations in
your second graph), the noise looks rather smaller than 0.03.
That is, your rolling loss looks less noisy I would expect from
what the blue envelope seems to be telling me about the noise
in the unaveraged p_ts.
Again, it’s hard for me to make a clear-cut case about this, since I
can’t see the specific p_t values inside the blue envelope, and it’s
hard to prove the negative that there aren’t any weird correlations
that would cause the noise to average away unexpectedly rapidly.
If we take your rolling-loss graph at face value, it suggests that
averaging over 100 p_t values averages away enough noise
to make the effect clearly visible. Would it be possible to run 100
independent training runs (instead of 5), and average those runs
to make a graph of the (averaged over runs) p_ts, but without
any rolling-loss average?
The rolling-loss average isn’t an illegitimate way to try to dig
some signal out of the noise, but it does complicate the analysis
somewhat (and the results do look fishy to me). It’s not that I don’t
see the effect in the blue envelope – it’s just that rolling-loss graph
noise doesn’t agree with the simplest batch-to-batch fluctuations
suggested by the blue envelope.
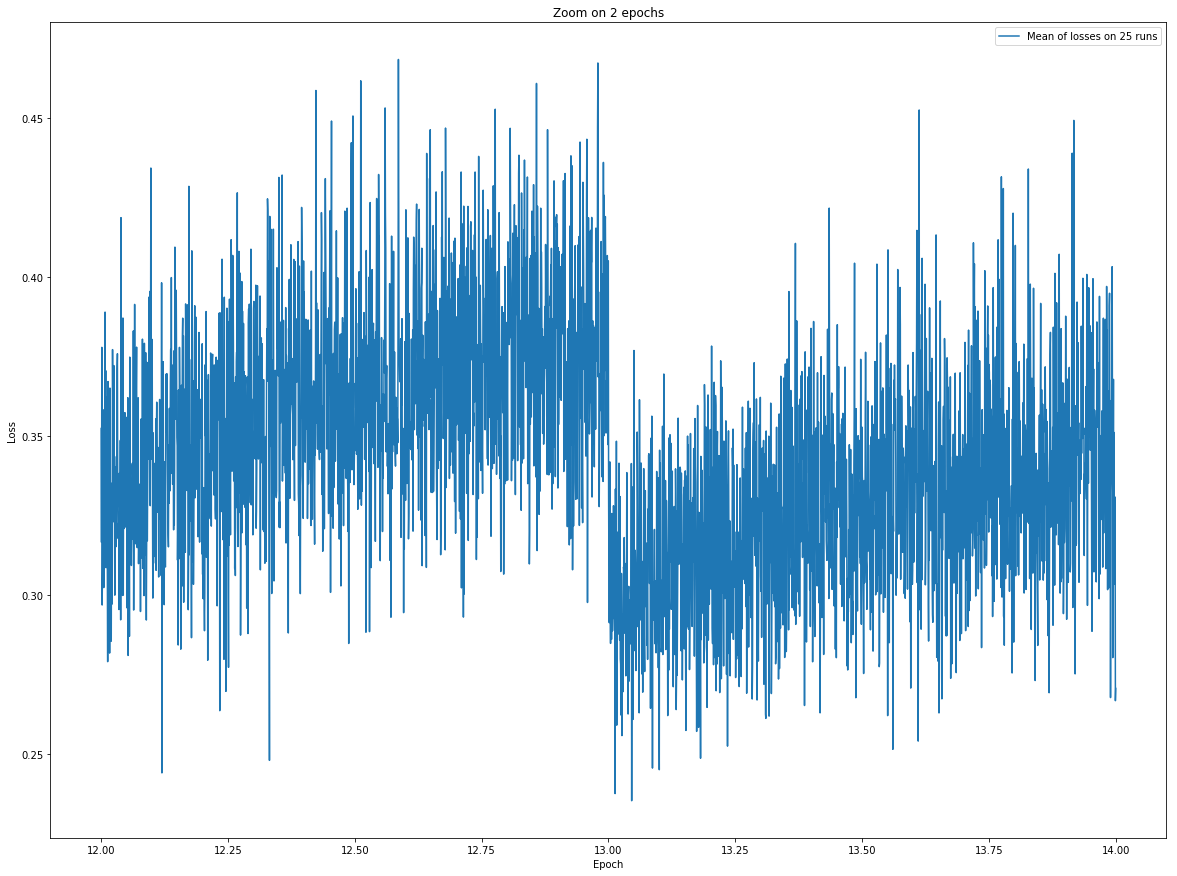
If you do 100 runs, could you plot not only the whole (averaged)
training run, but also a couple of epochs and epoch transition
regions where we can see individual points in the graph?
As an aside, this code for the rolling average looks correct to
me (with the quibble that in your training loop you build the list train_losses, but here you calculate the rolling-loss from
something called train_bn).
Also, based on assuming that you use the 50,000-sample CIFAR-10
training dataset for your training, I estimate that you batch size is
about 32, and that you have about 1,500 batches per epoch. Are
these values approximately correct?
Now for some idle speculation: It’s does look like something is
happening at epoch boundaries, but I can’t think of a straightforward
explanation that fits.
It appears that you use a shuffling dataloader to create your
batches, so this explanation doesn’t apply. But suppose you didn’t
shuffle, and you simply generated batches in the original order
of the CIFAR data. (I don’t know what that order is, by the way.)
If the CIFAR had easier samples towards the beginning, and
harder samples toward the end (perhaps ordered by class, and
easier classes happened to come first), we could easily see your
effect.
But you do shuffle. Now, within an epoch, all the batches contain
different samples, so as you train, you don’t get the benefit of
seeing again a sample you’ve already trained on. But across
an epoch boundary, the first batches you see could happen to
include samples that were seen recently in the last few batches
of the previous epoch. This could give your network the advantage
of being asked to classify a sample that it had recent trained on
(from a batch in the previous epoch), thereby having an easier
task and a lower a loss.
However, with a batch size of 32, I just don’t see this happening
enough to produce a dramatic (or even noticeable) effect.
Nonetheless, if this were the case, you could do the following
test. If you created batches by drawing samples with
replacement (@ptrblck – is there a pre-packaged sampling-
with-replacement dataloader, or a simple strategy to write one?)
then there would be no actual epoch boundaries – an “epoch”
would be a number of training samples equal to the size of
your training set, but some samples would occur (randomly)
more than once in an “epoch,” and some not at all.
If the sawtooth-loss structure persisted with this test, it would
indicate clearly a weird bug somewhere.
Again, idle speculation. There is something going on at your
epoch boundaries, but it’s hard to guess what it might be with
the data partially hidden.
RandomSampler with replacement=True should probably do the job, if I understand your suggestion correctly.
Side note: the DataLoader creates this sampler by default, if shuffle=True is specified, but uses replacement=False.
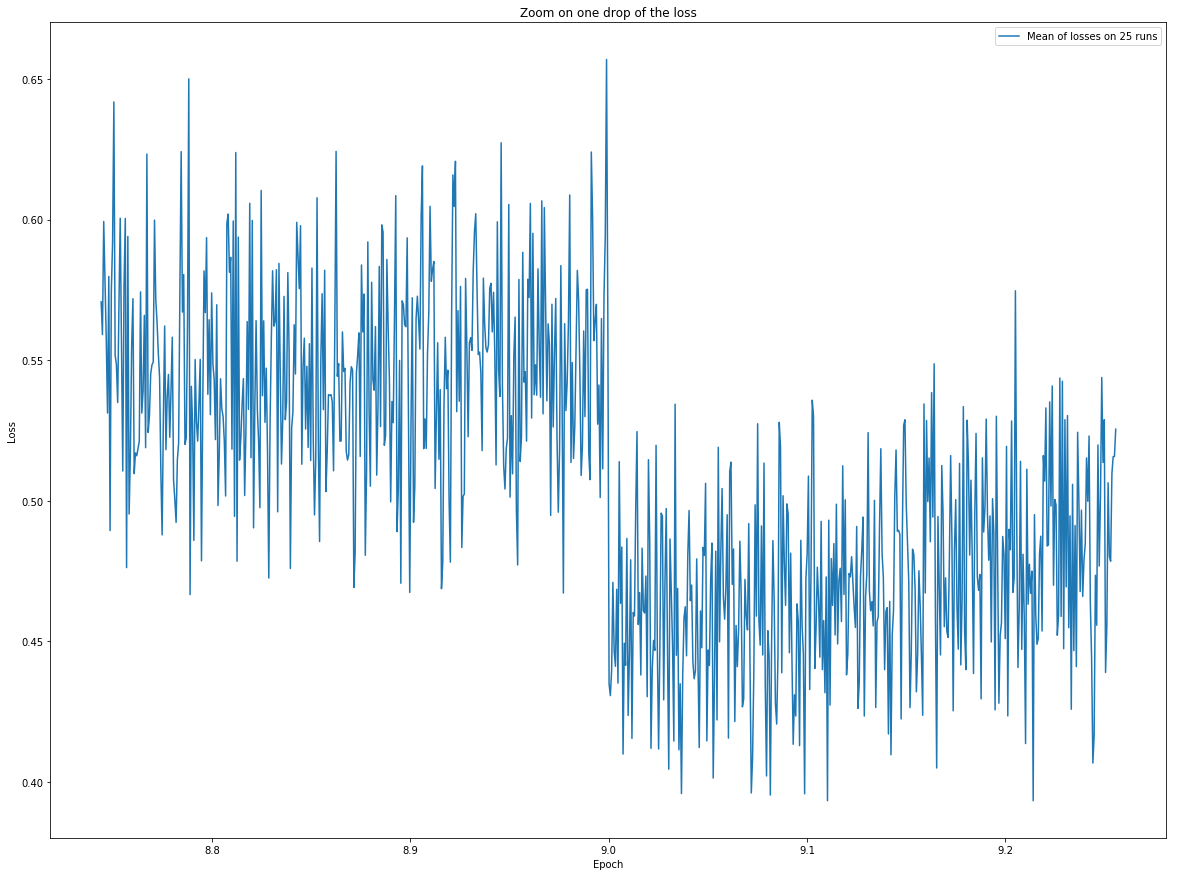
First of all, here is a zoom on the first graph around the drop at epoch 9 so that you can have a better view of the individual points (the 400th mini batch here is the batch 0 of epoch 9):
Obviously it’s just an example, but to me it seems that over the span of the drop, the most important part of the p_{t+100}s are indeed lower than the corresponding p_ts.
Concerning the noise : I don’t know if it really helps, but I computed the std for the mini-batches 0 to 300 (as numbered in the above graph, using np.std), and the result is ~0.07. The std of the rolling loss over the same mini-batches is ~0.009.
The same computation for the mini batches 400 to 800 yields ~0.07 and ~0.005. So it seems that averaging over 100 values does indeed reduce the spread by a factor of ~10?
Training 100 models would be quite long on my computer, but I can at least try to get more than 5. Here are some temporary results with 25 runs (more are training as I’m writing these lines, I’ll provide more graphs when I’ll have more data). If it’s not exactly the kind of graph you wanted, please tell me.
Yes they are. I’m using a batch-size of 32, and there are precisely 1562 batches per epoch (all of them being of size 32 because of the drop_last parameter in the train loader, otherwise the 1563rd batch would be of size 16).
I see your point concerning the fact that the network could have an advantage on recently presented samples. I will try using the RandomSampler as soon as my computer is finished with all the runs for the graph you previously asked for.
To my eye, they further demonstrate the epoch-boundary-drop
you showed in your first post.
Looking at these, I no longer see evidence for any discrepancy
between the rolling-average and single-batch results. (My intuition
about how they should be related was clearly off.)
Don’t kill yourself trying to get 100 runs if it’s too slow and painful.
It would be nice, but not necessarily worth it if it’s a lot of trouble.
There is clearly something going on at the epoch boundaries.
Unless there’s just a bug somewhere, the only thing that happens
at the epoch boundaries is the change in the character of the
batches (relative to recent batches in the previous epoch).
I’m leaning towards believing my story about the new epoch having
some samples be recent repeats. (It’s really all I can think of.) I’m
somewhat surprised that the effect could be so large, but I don’t
really have any intuition about the CIFAR dataset or the VGG16
network.
I do believe that if you create batches with random drawing with
replacement, there should be no change in batch character at
the epoch boundaries. (In fact, there won’t really be any epoch
boundaries except those from “arbitrarily” counting the number
of batches.) So the effect should vanish entirely.
If it doesn’t, I would say look for a bug somewhere. But you have
a very simple nested loop where you loop over epochs and then
loop over batches, so I just don’t see where an epoch-boundary
bug could sneak in …
Anyway, I think your code is sound (in this respect – I’m not saying
there couldn’t be other little nits here and there …). I think the test
with batch-sampling-with-replacement is the thing to do.
This is probably unrelated, but additionally to the suggested experiment, you could also try to drop the last batch, if it is smaller than the rest by using drop_last=True in your DataLoader.
If the last batch is much smaller than the preceding ones, the running estimates might get a “bad update” , which could yield some unexpected loss values in the beginning of the new epoch.
I doubt this effect is that large, but might be a quick experiment.
I’m trying to train the network using a RandomSampler as suggested. However, if I understood correctly, it only yields a single index at a time, so I have to wrap it with a BatchSampler (?)
When I test it, I get a TypeError (the following code is enough to reproduce the error).
trainloader = prep_data(32, 1)
for i, data in enumerate(trainloader):
    print(i)
TypeError                                 Traceback (most recent call last)
<ipython-input-1-5c625c535dea> in <module>()
     22
     23 trainloader = prep_data(32, 1)
---> 24 for i, data in enumerate(trainloader):
     25     print(i)

/anaconda3/lib/python3.6/site-packages/torch/utils/data/dataloader.py in __next__(self)
    344     def __next__(self):
    345         index = self._next_index()  # may raise StopIteration
--> 346         data = self.dataset_fetcher.fetch(index)  # may raise StopIteration
    347         if self.pin_memory:
    348             data = _utils.pin_memory.pin_memory(data)

/anaconda3/lib/python3.6/site-packages/torch/utils/data/_utils/fetch.py in fetch(self, possibly_batched_index)
     42     def fetch(self, possibly_batched_index):
     43         if self.auto_collation:
---> 44             data = [self.dataset[idx] for idx in possibly_batched_index]
     45         else:
     46             data = self.dataset[possibly_batched_index]

/anaconda3/lib/python3.6/site-packages/torch/utils/data/_utils/fetch.py in <listcomp>(.0)
     42     def fetch(self, possibly_batched_index):
     43         if self.auto_collation:
---> 44             data = [self.dataset[idx] for idx in possibly_batched_index]
     45         else:
     46             data = self.dataset[possibly_batched_index]

/anaconda3/lib/python3.6/site-packages/torchvision/datasets/cifar.py in __getitem__(self, index)
    116         #    tuple: (image, target) where target is index of the target class.
    117
--> 118         img, target = self.data[index], self.targets[index]
    119
    120         # doing this so that it is consistent with all other datasets

TypeError: list indices must be integers or slices, not list
I tried to get a little bit further, and it seems that self._next_index() returns an array of shape (1, 32) instead of (32) (so the list comprehension doesn’t separate the indexes as expected by the dataset). I got it to run by replacing it with self._next_index()[0]…
I had never used samplers before, so I’m not really sure of what I’m doing here. Am I doing well in my prep_data function? And my solution to avoid the error is quite of a messy workaround, so is there a better way to handle it?
I haven’t used samplers either, so I’m not certain of what is
going on.
However, looking at the DataLoader documentation, it appears
that the DataLoader() constructor has two mutually-exclusive
arguments, sampler and batch_sampler. Your code is using sampler.
Is it possible that in order to use trainSampler, the BatchSampler you’ve constructed, you have to pass it
in as batch_sampler = trainSampler?
It worked ! With the replacement method there are no more drops. Thank you so much.
Concerning your 100 runs graph, I’ll stop at 50 (it takes too much time). There isn’t much difference with 25, just a little bit less noise and more defined drops.
So it seems that the problem was coming from the DataLoader. I’d still like to know why, as I think that my first approach should have worked… I did a quick test, following the Pytorch tutorial (I slightly modified it to get batches of size 32, more epochs, and all the losses) I trained 10 small models. The drops are already visible.
To me, this is strong evidence that there isn’t some weird bug
in your code causing the epoch-boundary drops.
I’m very much believing the theory that the drops are caused
by the fact that the new batches near the start of a new epoch
can contain samples that were recently seen in batches near
the end of the previous epoch.
No worries. There’s nothing magic about 100 runs (or even 50).
As long as you have enough runs to be able to see through the
noise, that’s enough.
I’m inclined to doubt that there is anything wrong with the
DataLoader (other than that it’s doing what it was designed
to do – which may or may not be what you want).
The DataLoader gives you an entire epoch of samples, one batch
at a time, without any repeats. When you go on to a new epoch,
you sometimes will get repeats of recently seen samples. You
would expect this to give the network an advantage, and lead to
a lower loss. The only question is whether this effect would be
large enough to be significant and/or noticeable. (I suppose
you could call this a “statistical bias” of a sort, but it is what the
DataLoader is supposed to do.)
(I think this theory could be tested, but at the cost of writing a
custom Sampler.)
If it’s easy, I would be interested in seeing a head-to-head
comparison of graphs (averaged over the same number of runs,
etc.), where the only difference is using the shuffled, no-repeat
DataLoader vs. the drawing-with-replacement RandomSampler.
I see your point concerning the DataLoader, and I’d really like to test your theory. However my final exams are approaching, and I’m afraid I won’t have enough time…
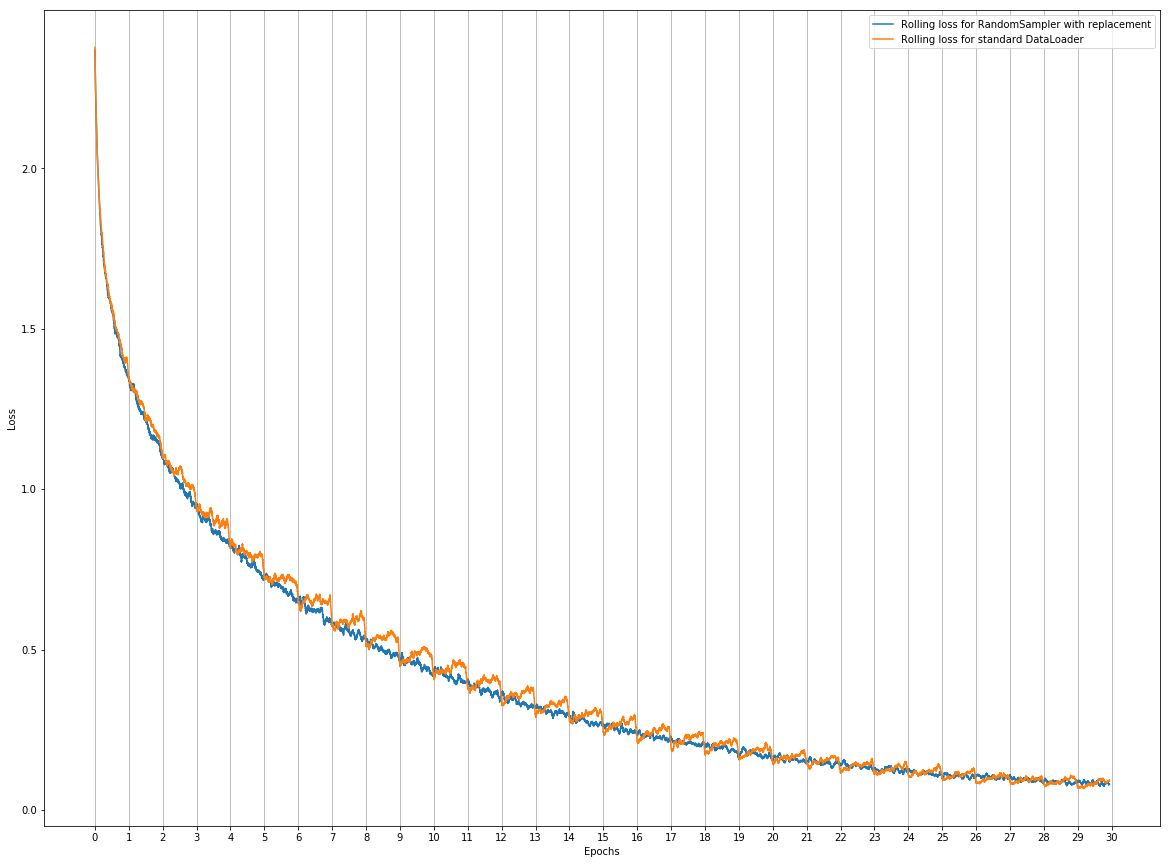
Concerning the comparison of graphs, I made one comparing the rolling averages for both methods (averaging on 5 runs for each) :
Thanks for posting the comparison graph. It shows the effect
you discovered very clearly. To my eye, I see absolutely nothing
going on at the epoch boundaries in the blue RandomSampler
curve (in contrast to the strong DataLoader effect).
Hi everyone, this happened to me too. Random sampling with replacement amortizes the gap over multiple steps, so the steps get smoothed out.
But the real problem was that the model was aggressively overfitting. This meant that the loss for an example was almost directly proportional to the number of times the model had seen that example. So to fix the step function, I had to reduce the overfitting (in my case, by adding regularization between two large linear layers). That was the real problem (not the sampling issue).