Hello,
I am seeking advice on how to reduce the training time for my model. Below are some specifications for my model and data:
Model: Contextual Neural Collaborative Filtering (specifications provided at the end)
- Model Size: 47.51 MB
- Trainable Parameters: 12,453,873
As indicated, the model itself is not large, but I am working with a substantial dataset in terms of the number of instances:
- Train Data Size: 586.05 MB
- Training Data Shape: (3,647,614; 24)
Additionally, the getitem method in the custom dataset dynamically creates X negative instances, in this case 4, per positive instance, resulting in a total of:
Training Points: 3,647,614 x 5 = 18,238,070 instances
With a batch size of 256, this equates to approximately 13,800 batches, each containing an average of 1,584 instances.
Since the data is lightweight, I load it entirely into RAM, minimizing data retrieval time and I/O operations. Furthermore, given the modest size of the model (47.51 MB) and peak memory usage (approximately 150 MB when tensors are loaded), the performance difference between training on a GPU and a CPU is not significant. Here are the training times for each:
- CPU Total Time per Epoch: 142.77 minutes, detailed as follows:
- Training Time: 138.99 minutes
- Testing Time: 8.05 minutes
- GPU Total Time per Epoch: 106.34 minutes, detailed as follows:
- Training Time: 99.99 minutes
- Testing Time: 7.44 minutes
On the CPU, the average time to process a hundred batches is:
- 100 Batches: 45 seconds
Additionally, the resource summary from the job submitted to the HPC indicates:
- CPU Average Efficiency: 20.00%
- CPU Peak Efficiency: 20.17%
For this job, five CPU cores were requested, which suggests that the model operations were not parallelized and were performed on a single CPU.
To gain a better understanding of how parallelization works, I replicated the experiment on my own laptop and monitored the system using htop. Here’s what I observed:
| Column 1 | Column 2 | Column 3 | Column 4 | E | F | G | H | I | J | K | L |
|---|---|---|---|---|---|---|---|---|---|---|---|
| PID | USER | PRI | NI | VIRT | RES | SHR | S | CPU% | MEM% | TIME+ | Command |
| 9580 | alexabades | 20 | 0 | 24.8GB | 502M | 162M | R | 162 | 64 | 0:45:12 | python |
| 9581 | alexabades | 20 | 0 | 24.8GB | 502M | 162M | R | 0 | 64 | 0:00:09 | python |
| 9582 | alexabades | 20 | 0 | 24.8GB | 502M | 162M | R | 0 | 64 | 0:00:09 | python |
| 9582 | alexabades | 20 | 0 | 24.8GB | 502M | 162M | R | 0 | 64 | 0:00:10 | python |
| 9583 | alexabades | 20 | 0 | 24.8GB | 502M | 162M | R | 0 | 64 | 0:00:10 | python |
| 9584 | alexabades | 20 | 0 | 24.8GB | 502M | 162M | R | 0 | 64 | 0:00:10 | python |
| 9585 | alexabades | 20 | 0 | 24.8GB | 502M | 162M | R | 0 | 64 | 0:00:10 | python |
| 9586 | alexabades | 20 | 0 | 24.8GB | 502M | 162M | R | 0 | 64 | 0:00:10 | python |
| 9587 | alexabades | 20 | 0 | 24.8GB | 502M | 162M | R | 0 | 64 | 0:00:10 | python |
| 9588 | alexabades | 20 | 0 | 24.8GB | 502M | 162M | R | 0 | 64 | 0:00:10 | python |
| 9589 | alexabades | 20 | 0 | 24.8GB | 502M | 162M | R | 0 | 64 | 0:00:09 | python |
| 9590 | alexabades | 20 | 0 | 24.8GB | 502M | 162M | R | 0 | 64 | 0:00:10 | python |
| 9591 | alexabades | 20 | 0 | 24.8GB | 502M | 162M | R | 0 | 64 | 0:00:10 | python |
| 9610 | alexabades | 20 | 0 | 24.8GB | 502M | 162M | R | 120 | 64 | 0:03:16 | python |
| 9611 | alexabades | 20 | 0 | 24.8GB | 502M | 162M | R | 120 | 64 | 0:03:16 | python |
| 9612 | alexabades | 20 | 0 | 24.8GB | 502M | 162M | R | 120 | 64 | 0:03:16 | python |
| 9613 | alexabades | 20 | 0 | 24.8GB | 502M | 162M | R | 120 | 64 | 0:03:16 | python |
| 9614 | alexabades | 20 | 0 | 24.8GB | 502M | 162M | R | 120 | 64 | 0:03:16 | python |
This observation suggests that Python initiated the script with PID 9580, and since the CPU required to train the model exceeded what a single core could handle, PyTorch parallelized the operations across five additional cores (PIDs 9610 to 9614). Each core utilized approximately 12.0% of the CPU. Consequently, this results in a combined usage of approximately 60-62%. Adding this to the 100% running on the core with PID 8580 totals approximately 162% of CPU utilization.
In an effort to optimize this setup, I explored the following options:
- Number of workers
- Number of threads
- DistributedDataParallel
Number of workers
As I understand it, the number of workers is primarily used to increase the number of processes that load data, which is particularly useful when the data is large and cannot be fully loaded into RAM, necessitating I/O operations to retrieve data. Although new processes (which should be dedicated to load data) were initiated on different cores, in this case, increasing the number of workers did not enhance performance since the data is already loaded in RAM. As a result, increasing the number of workers did not reduce the time it takes to process 100 batches:
- Time for 100 batches: 53.27 seconds
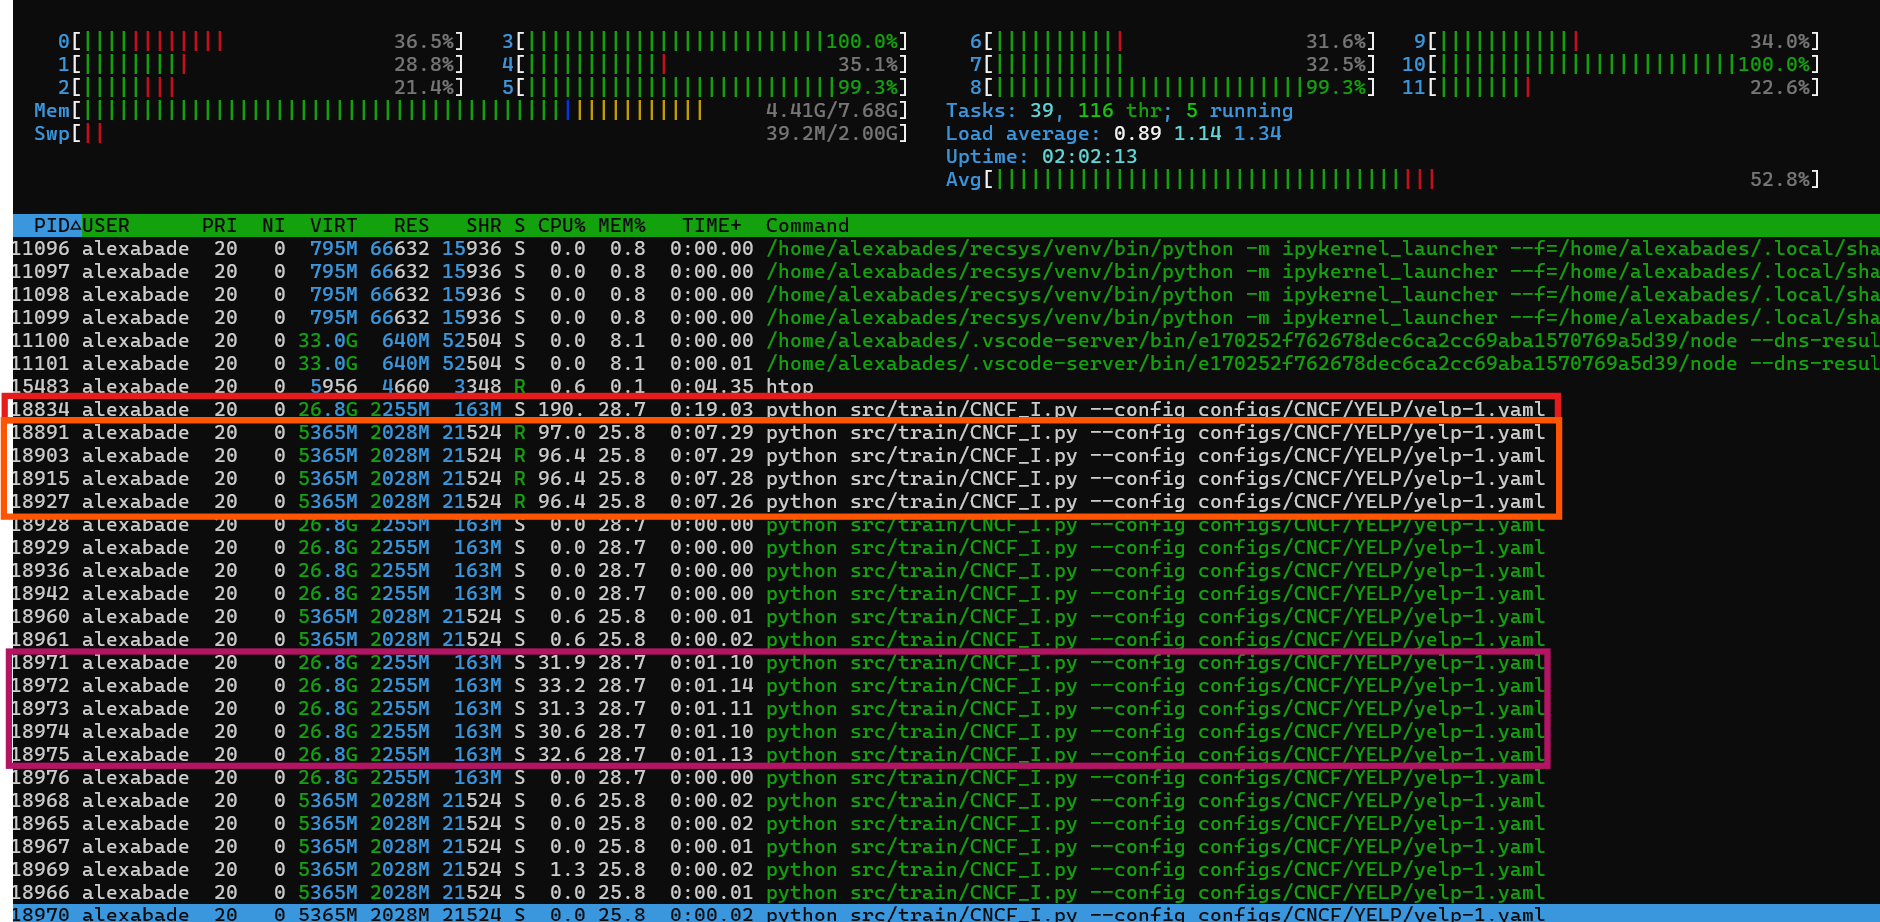
In Red the main process, in orange the workers dedicated to load data and in purple the 5 processes that pytorch has initialized.
Number of Threats
The number of threads is indeed a viable option for optimization. I attempted to increase this by:
os.environ["MKL_NUM_THREADS"] = "8"
os.environ["OMP_NUM_THREADS"] = "8"
torch.set_num_threads(8)
While I have observed the processes utilizing different CPU cores, there has been no improvement in the model training time:
- Time for 100 batches: 48.54 seconds
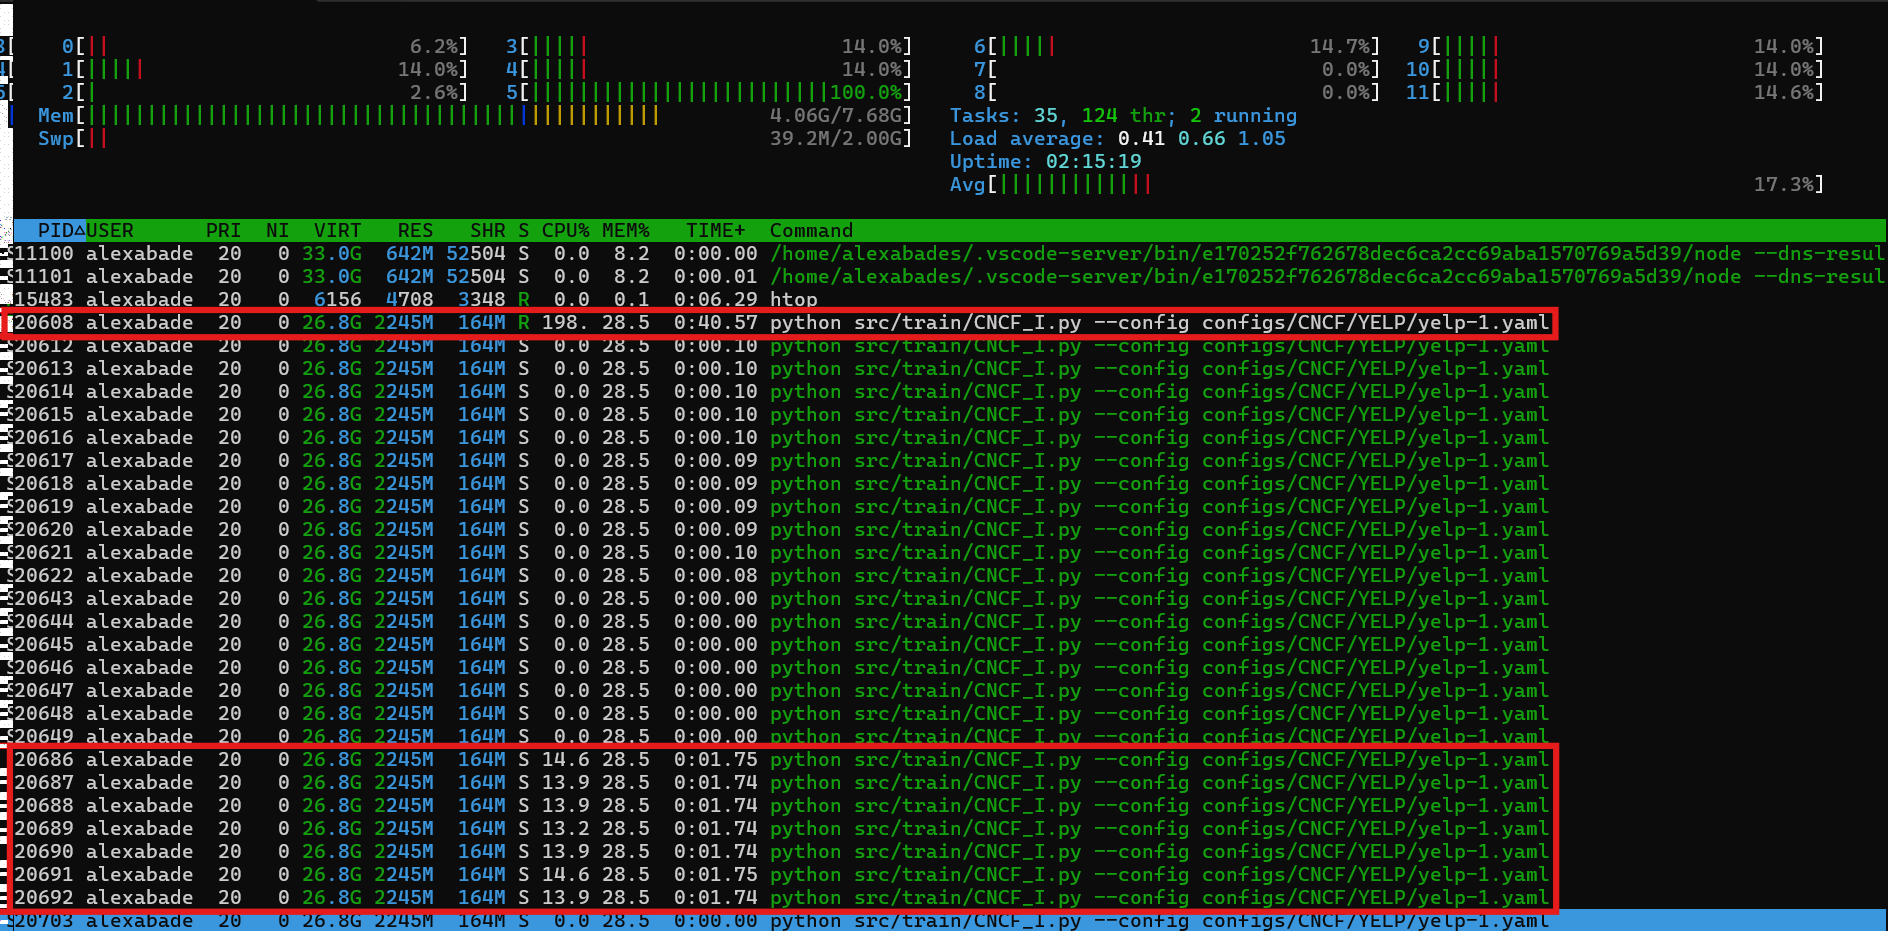
In orange the 8 processses specified with the number of threats.
Data Parallelization
Although this is typically used in scenarios where the model or data is too large to fit on a single GPU, I am attempting to apply it to parallelize the model across multiple CPU cores on a single machine. However, due to the RAM limitations of my laptop, I cannot test this hypothesis with my full dataset. Therefore, I have experimented with a subset of the data, which has a shape of (83,731, 24). The configuration for this test is roughly as follows:
- Batch size = 256
- Num of batches = 83731/256 = 327.07 which rounds up to 328 to ensure no data is lost.
- Instances per batch = 83731*5 / 328 = 1276.38
Due to the way PyTorch handles batching, this results in approximately 1280 instances per batch.
Following the guide provided at PyTorch’s DDP tutorial () and adapting my script accordingly, I have achieved the following setup:
Creation of 4 Ranks: Each rank loads the data and divides it into 4 splits, rounding up as needed with sampler, which in my case results in:
- Rank 0: 83731/4 = 20933
- Rank 1: 83731/4 = 20933
- Rank 2: 83731/4 = 20933
- Rank 3: 83731/4 = 20933
Therefore, the number of batches is calculated as follows:
- Number of batches = 20933 / 256 = 81.76 which rounds up to 82 to ensure no data is lost.
- Instances per batch = 20933 * 5 / 82 = 1276.40
Again, due to the way PyTorch handles this calculation, the batch size ends up being 1280 instances per batch.
The model is then instantiated four times, once for each rank, and then trained on these data samples. After each batch is processed, PyTorch gathers the gradients and performs an optimization step. This is a standard setup, not accounting for custom metrics, which are specific to my case. The calculations for the number of batches and training instances per batch can be generalized accordingly.
However, this approach has not improved my training time. Benchmarking this against the same data handled by a PyTorch model on a “single” CPU core, where processes are created on demand, performance times are comparable. I could provide a screenshot of htop to illustrate, but the multiprocess activity makes it difficult to discern anything clearly.
I suspect that the training time remains unchanged, even though the data is split among four cores, each with its own model instance, due to inter-core communication overhead. The optimizer function’s step must wait until all gradients are gathered at the central node, usually rank 0. Since each batch is processed in about 0.45 seconds, communication between nodes occurs at a high frequency, potentially negating the expected time savings from parallel processing.
Has anyone tried a different approach or have insights on how this type of model and training setup could be accelerated?
Thank you very much!
Model architecture:
ContextualNeuralCollavorativeFiltering(
  (embeddings): ContextAwareEmbeddings(
    (MF_Embedding_User): Embedding(654, 8)
    (MF_Embedding_Item): Embedding(1127, 8)
    (MLP_Embedding_User): Embedding(654, 32)
    (MLP_Embedding_Item): Embedding(1127, 32)
  )
  (GMF_model): GeneralMatrixFactorization()
  (MLP_model): MultiLayerPerceptron(
    (mlp_model): Sequential(
      (0): Linear(in_features=85, out_features=32, bias=True)
      (1): ReLU()
      (2): Dropout(p=0, inplace=False)
      (3): Linear(in_features=32, out_features=16, bias=True)
      (4): ReLU()
      (5): Dropout(p=0, inplace=False)
      (6): Linear(in_features=16, out_features=8, bias=True)
      (7): ReLU()
      (8): Dropout(p=0, inplace=False)
    )
  )
  (predict_layer): Linear(in_features=16, out_features=1, bias=True)
)