hello. Maybe it is the right place for this topic but I am working on this for a while but cannot succeed to implement it and need your help.
My goal is to reproduce this image bellow from the 3D pose data obtained from skeleton estimation of human pose using LCR-NET++
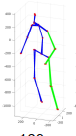
the pose estimation for one image frame is here:
“pose3d”: [-0.013501551933586597, -0.14018067717552185, 0.03889404982328415, -0.01468866690993309, -0.052195221185684204, -0.019107796251773834, 0.1497691571712494, 0.3384685516357422, -0.01354127749800682, 0.20444869995117188, -0.01537160761654377, 0.10283246636390686, 0.16161373257637024, -0.9542085528373718, -1.0142440795898438, -0.5674616694450378, -0.6482287049293518, -0.21104587614536285, -0.26092272996902466, 0.01090222503989935, -0.06246425583958626, 0.07578188925981522, -0.06475285440683365, 0.27830997109413147, 0.16628871858119965, 0.40817680954933167, 0.4491078853607178, 0.26747873425483704, 0.3288397789001465, 0.15092524886131287, 0.14701153337955475, -0.013860990293323994, 0.31942757964134216, -0.10401999950408936, 0.2921887934207916, -0.2079567015171051, 0.12265170365571976, -0.21420519053936005, -0.07994606345891953]
Here is my code. What is missing?
from mpl_toolkits import mplot3d

import numpy as np
import matplotlib.pyplot as plt

ax = plt.axes(projection='3d')

fig = plt.figure()
xdata = np.array([-0.013501551933586597, -0.14018067717552185, 0.03889404982328415, -0.01468866690993309, -0.052195221185684204, -0.019107796251773834, 0.1497691571712494, 0.3384685516357422, -0.01354127749800682, 0.20444869995117188, -0.01537160761654377, 0.10283246636390686, 0.16161373257637024])
ydata = np.array([-0.9542085528373718, -1.0142440795898438, -0.5674616694450378, -0.6482287049293518, -0.21104587614536285, -0.26092272996902466, 0.01090222503989935, -0.06246425583958626, 0.07578188925981522, -0.06475285440683365, 0.27830997109413147, 0.16628871858119965, 0.40817680954933167])
zdata = np.array([0.4491078853607178, 0.26747873425483704, 0.3288397789001465, 0.15092524886131287, 0.14701153337955475, -0.013860990293323994, 0.31942757964134216, -0.10401999950408936, 0.2921887934207916, -0.2079567015171051, 0.12265170365571976, -0.21420519053936005, -0.07994606345891953])
ax.scatter3D(xdata, ydata, zdata, c=zdata)

plt.show()