Is there a way to plot the histograms of a colored image in pytorch?
torch.histogram should work as seen here:
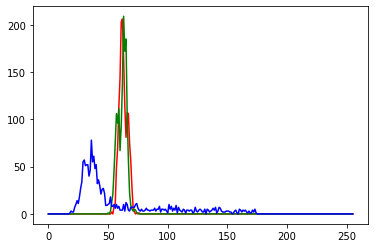
x = torch.from_numpy(np.array(image)).float()

bins = torch.linspace(0, 256, 257)
hist = [torch.histogram(c, bins=bins) for c in x]

plt.plot(hist[0].bin_edges[:-1], hist[0].hist, color="r")
plt.plot(hist[1].bin_edges[:-1], hist[1].hist, color="g")
plt.plot(hist[2].bin_edges[:-1], hist[2].hist, color="b")
You can change the bins of course if you don’t want to count each pixel value.
Thank you for your answer.