Currently you are accumulating the batch loss in running_loss. If you just would like to plot the loss for each epoch, divide the running_loss by the number of batches and append it to loss_values in each epoch.
Note, that this might give you a slightly biased loss if the last batch is smaller than the others, so let me know if you need the exact loss.
Thank you for your reply. I will probably need an exact loss when I use the full dataset, but I’m only using a small portion of it, so probably don’t require that right now.
If you could tell me how to get exact values, then that would be great for when I use the full dataset.
I’m just a bit coursed about ‘append it to loss_values in each epoch’. Based on the image I posted, the x axis is not the epochs. I believe it is using the optimizer.step values instead.
You could use the ImageNet example or the following manual approach:
for epoch in range(num_epochs):
    running_loss = 0.0
    for i, data in enumerate(trainloader, 0):
        running_loss =+ loss.item() * images.size(0)

    loss_values.append(running_loss / len(train_dataset))

plt.plot(loss_values)
This code would plot a single loss value for each epoch. Would that work?
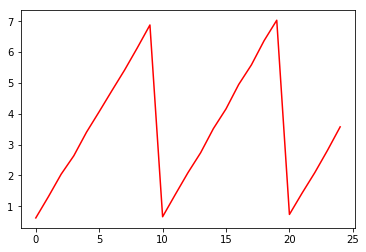
Thank you for your reply. I can already plot the loss curve for one epoch, but I was looking to plot the loss for a number of epochs. Using the manual approach you suggested above, this is the loss curve generated:
I am attempting to do only 2 epochs according to the line model = train(vgg16, 2). I am unsure where the 25 on the x axis is coming from. I believe it may have something to do with the optimist.step? Also, my trainset is 100 images and my batch size in the trainloader is 4, so perhaps it maybe something to with that instead?
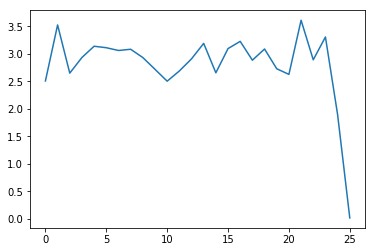
Sorry, I am trying to show different histograms on one figures by seaborn.
One time I use (sns.displot(), and another time I use sns.histplot().
The problem is that the order of the histograms has change and it shouldn’t happen. I used these command, the hue is same. every thing is same I just replace sns.displot() with sns.histplot()
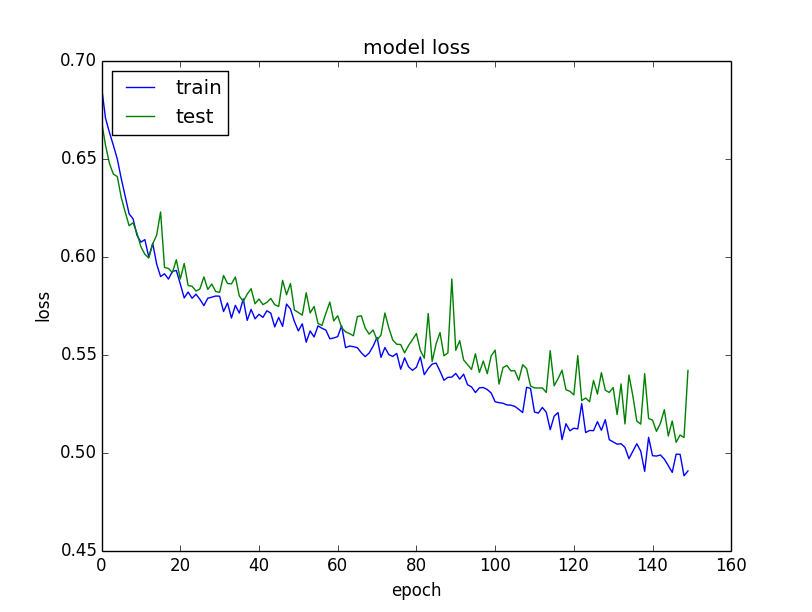
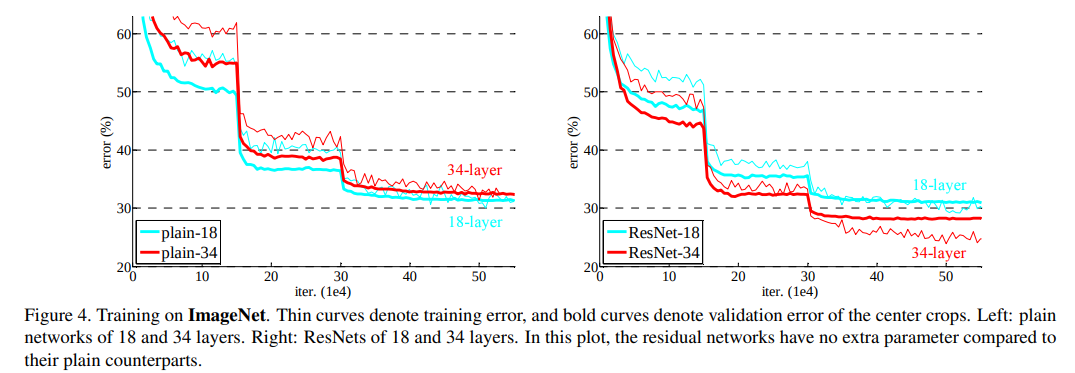
In case of loss wrt epochs, it is clear, as you described, you just average over the whole dataset for both train/val sets, but for error wrt iterations it is less obvious to me.
To get the validation error/loss, I guess they freeze the model time-to-time (for a given number of training iterations ~5K) then they evaluate error on the whole val set (an epoch of the val set). Is that correct?
But how to get the training error they plot wrt iterations? Do they compute a running error on the last train iterations (how many?) ? Do they reset training running error at some point? Do they fix the weights and compute error on the whole train set as for the val set (I guess not because the training curve is much less smooth than the val one) ?
More general question: when we do not want to work “per epochs”, but “per iterations” (when the dataset is very large for example), what are good practices to report train/val loss/error?
Thank you @ptrblck for all you very good answers you provide every times on this forum!
That might be the case, but I would hope the actual research paper would describe their approach (or maybe you could find a repository with their implementation?).
The definite answer would come from the authors, but I would guess the current (mean) batch loss is used to create the training loss curves.
Actually I was not able to find answers in the paper/code that is why I was asking for good practices/general practices when we work wrt iterations and not epochs
Sorry for the out of date question but I came across this answer because I have a similar issue and wanted to ask, why do you multiply the loss with the image size ?
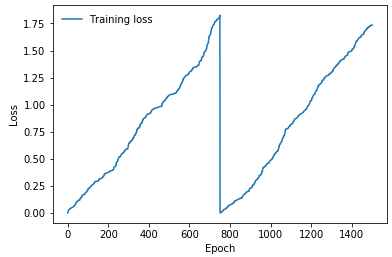
If I have 3 epochs and 12942 steps per epoch, can I not do the following in my training loop ?
total_losses = []
for epoch_i in range(0, epochs):
    losses = []
    for step, batch in enumerate(train_dataloader):

        b_input_ids = batch[0].to(device)
        b_labels = batch[0].to(device)
        b_masks = batch[1].to(device)

        model.zero_grad()

        outputs = model(b_input_ids, labels=b_labels, attention_mask=b_masks, token_type_ids=None)

        loss = outputs[0]

        batch_loss = loss.item()
        losses.append(batch_loss)
  total_losses.append(losses)
And so fill the total_losses array with 3 sub-arrays with each having the epoch losses ?
I assume you are referring to this post where the loss of the current batch is multiplied with the batch size and later divided by the number of images (i.e. the length of the dataset).
Your calculation accumulates the batch loss and divides by the number of batches afterwards (i.e. the length of the DataLoader). If not all batches contain the same number of samples your calculation would add a small error to the mean epoch loss while my approach would not run into this issue.
This would be the case if the number of samples are not divisible by the batch size without a remainder and if drop_last is set to False (the default) in the DataLoader.