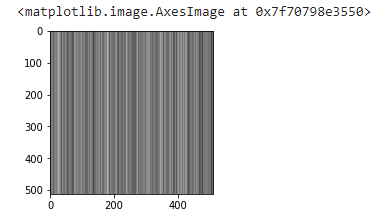
I am trying to plot a tensor in which EIGEN_VALUE when added to the latent variable generates the image.but i am getting this output
import matplotlib.pyplot as plt
##Latent code
code_1 = torch.randn(1, generator.z_space_dim).cuda()
code_1 = generator.layer0.pixel_norm(code_1)
code_1.shape
small alpha leads to good results
alpha_1=0.0000005
CODE =code_1.cpu().detach()
CODE.shape
EIGEN_VALUE= np.matrix(u1)
EIGEN_T = torch.from_numpy(n)
FINAL = CODE + alpha_1 * EIGEN_T
##ploting
plt.figure(figsize=(3,3))
plt.imshow(FINAL,cmap=‘gray’)