Problem converting MNIST images to RGB

Hello, I am trying to convert the images form MNIST to RGB using torch.transforms, my code is as follows:

IMG_SIZE = 32 
DEVICE = 'cuda' if torch.cuda.is_available() else 'cpu'

BATCH_SIZE = 256

TRANSFORM = transforms.Compose([
    #transforms.Lambda(lambda x: x.convert('RGB')),
    transforms.Resize(IMG_SIZE),
    transforms.ToTensor(),
    transforms.Lambda(lambda x: x.repeat(3, 1, 1)),
    transforms.Normalize((0.5, 0.5, 0.5), (0.5, 0.5, 0.5))
])

mnist_train = datasets.MNIST(root='./data', train=True, download=True, transform=TRANSFORM)
usps_train = datasets.USPS(root='./data', train=True, download=True, transform=TRANSFORM)

mnist_loader = torch.utils.data.DataLoader(mnist_train, batch_size=BATCH_SIZE, shuffle=True)
usps_loader = torch.utils.data.DataLoader(usps_train, batch_size=BATCH_SIZE, shuffle=True)

mnist_test = datasets.MNIST(root='./data', train=False, download=True, transform=TRANSFORM)
usps_test = datasets.USPS(root='./data', train=False, download=True, transform=TRANSFORM)

mnist_test_loader = torch.utils.data.DataLoader(mnist_test, batch_size=BATCH_SIZE)
usps_test_loader = torch.utils.data.DataLoader(usps_test, batch_size=BATCH_SIZE)

X_test_fixed = next(iter(mnist_test_loader))[0]
Y_test_fixed = next(iter(usps_test_loader))[0]

The code works fine and I get RGB images, but when I try to visualize them I get these weird results.
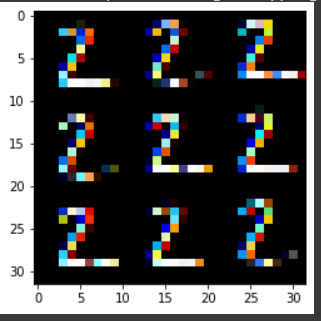
image
To visualize the image I used

plt.imshow(X_test_fixed[1].reshape(32,32,3))
plt.show()

I would appreciate any help, I even tried to use the convert function from PIL and the result is the same.

I believe this might be because you are resizing after converting to RGB, which could introduce artifacts due to the interpolation method. Could you try converting to RGB after resizing and see if that improves the results?

That is what I did, the transforms.Lambda function is the one that make the conversion to RGB, if you mean using the .convert(‘RGB’), I also changed the position as you said and I got the same result.

Sorry, I didn’t see the use of repeat to implement the RGB transform. The reason you are seeing the strange output is because you are visualizing the data after normalization (which by the way seems to be using strange values as MNIST mean and standard deviation are both < 0.5 neural network - How mean and deviation come out with MNIST dataset? - Data Science Stack Exchange). This mean subtraction will cause shifts in how the colors are displayed because pyplot.imshow() will clamp the values to [0,1] (you will see a warning about this).

If you remove the normalization the image looks as expected. In other words normalization is fine as a preprocessing step, but I would be cautious in applying it before trying to display the image.

Thanks for your response, I also thought the same, but no, the problem is still there if I remove the normalization.

Well, just in case, I could solve the problem and it was not about the transformers but the reshape I did to the image, the proper way to do it is by using np.transpose() and switching the indices.