Recently I am learning to use PyTorch to solve a maximum likelihood problem as described below, and I got a problem with the updates of the parameters.
- Data Description
The data comes from the functionsample_data. It contains 10000 observed value of a random variable, each value denotes the interval it lies.
import numpy as np

def sample_data():
    count = 10000
    rand = np.random.RandomState(0)
    a = 0.3 + 0.1 * rand.randn(count)
    b = 0.8 + 0.05 * rand.randn(count)
    mask = rand.rand(count) < 0.5
    samples = np.clip(a * mask + b * (1 - mask), 0.0, 1.0)
    return np.digitize(samples, np.linspace(0.0, 1.0, 100))
- Problem Description
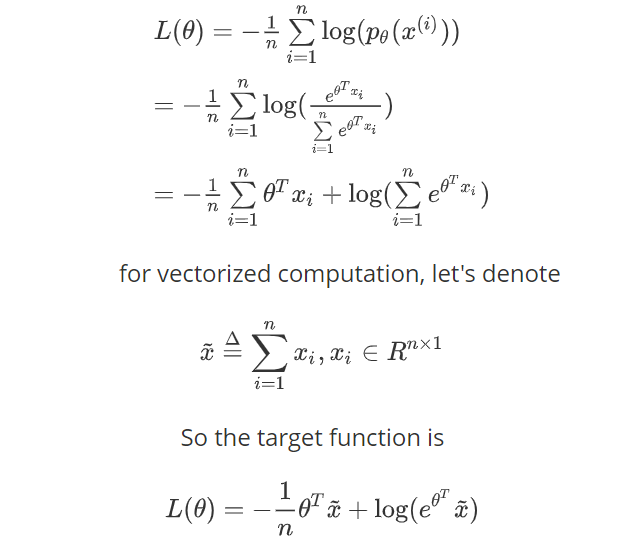
for these observed data, I used the maximum likelihood method with the softmax function to fit the distribution of each interval from 0 - 100.
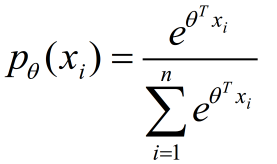
Here x_i is an One-hot encoding vector of the same size with θ, and my reasoning processing for the maximum likelihood is in the below pic.
- Problem with PyTorch implementation
Here is my implementation for this problem
import torch
import torch.nn as nn
from collections import Counter

def sum_x(x):
    dict_item = Counter(x)
    keys_item = dict_item.keys()
    input_of_x = np.zeros((100, 1))
    for key in keys_item:
        input_of_x[key, 0] = dict_item[key]
    return input_of_x

def loss_function(theta, x_fre):
    x = torch.from_numpy(x_fre).float()
    loss = -1/8000 * torch.mm(theta, x) + torch.log(torch.mm(torch.exp(theta), x))
    return loss

X = sample_data()
X_train, X_test = X[:8000], X[8000:]
x_fre = sum_x(X_train)
loss_list = []
theta = torch.zeros((1, 100), requires_grad = True).float()
optimizer = torch.optim.Adam([theta], lr=0.001)

for index in range(1000):
    loss = loss_function(theta, x_fre)
    loss.backward()
    optimizer.step()
    optimizer.zero_grad()
    loss_list.append(loss)


plt.plot(range(len(loss_list)), loss_list)
plt.show()
and the result is show as below
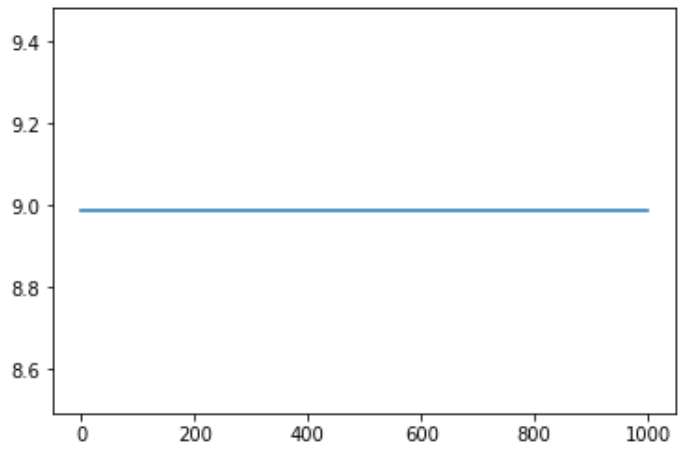
but the prob distribution should have the shape like mixed of two gaussian for

It makes me confusing for days. Is anywhere I made a mistake?
Thanks for anyone who can help me with this.