Hi, I am using profiler to count cuda kernels time, but I met a very strange question.
codes is below:
x = torch.randn((10, 3, 224, 224)).cuda()
a = torch.randn((5, 6, 7, 8))
with torch.autograd.profiler.profile(use_cuda=True) as prof:
y = x ** 2
y = y + 1.5
y = y * 2.4
y = torch.relu(y)
b = a + 1.1
y = y * 1/4
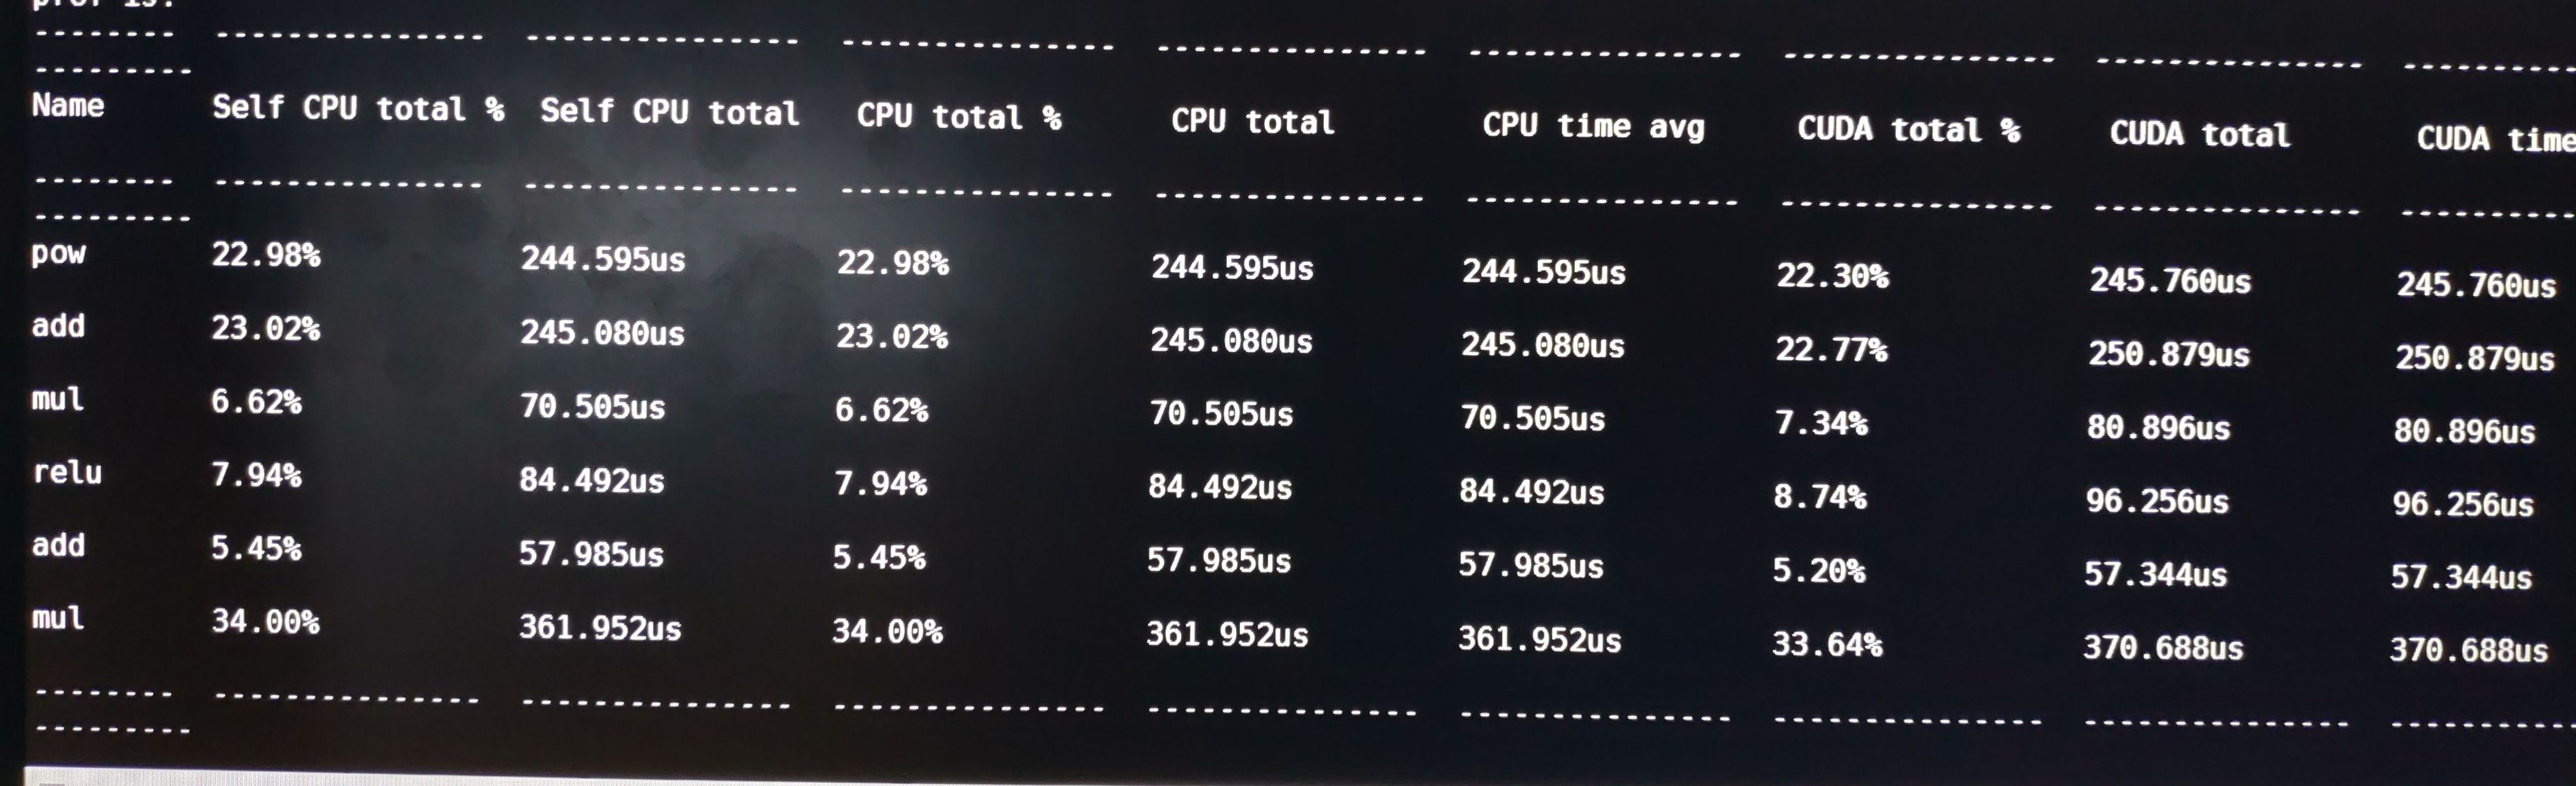
print("prof is:\n{}".format(prof))
and I find the kernel a is placed on cpu, but in profiler table, its time also shown, and its cpu time are neally nearly to cuda time. I am confused.