Hi, I want to further understand how PyTorch profiles CPU memory usages.
e.g, see:
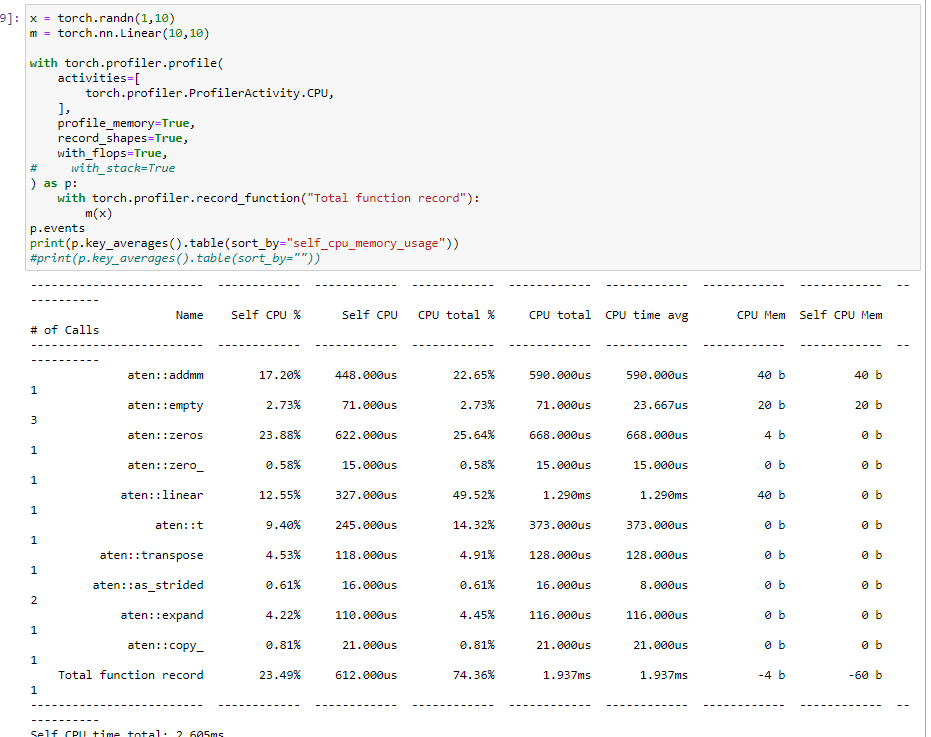
How should I interpret the total memory consumption of this call (which is just the simplest invocation of
torch.nn.Linear)The recorded function consumes
- memory. (?).
In the recorded events, seems it is somehow not the first event to get recorded. (?)
Name Self CPU % Self CPU CPU total % CPU total CPU time avg CPU Mem Self CPU Mem # of Calls Input Shapes
          aten::zeros        23.88%     622.000us        25.64%     668.000us     668.000us           4 b           0 b             1                   [[], [], [], [], []]
          aten::empty         1.19%      31.000us         1.19%      31.000us      31.000us           4 b           4 b             1               [[], [], [], [], [], []]
          aten::zero_         0.58%      15.000us         0.58%      15.000us      15.000us           0 b           0 b             1                                  [[1]]
Total function record        23.49%     612.000us        74.36%       1.937ms       1.937ms          -4 b         -60 b             1                                     []
          aten::empty         1.34%      35.000us         1.34%      35.000us      35.000us          16 b          16 b             1               [[], [], [], [], [], []]
         aten::linear        12.55%     327.000us        49.52%       1.290ms       1.290ms          40 b           0 b             1              [[1, 10], [10, 10], [10]]
              aten::t         9.40%     245.000us        14.32%     373.000us     373.000us           0 b           0 b             1                             [[10, 10]]
      aten::transpose         4.53%     118.000us         4.91%     128.000us     128.000us           0 b           0 b             1                     [[10, 10], [], []]
     aten::as_strided         0.38%      10.000us         0.38%      10.000us      10.000us           0 b           0 b             1                 [[10, 10], [], [], []]
          aten::addmm        17.20%     448.000us        22.65%     590.000us     590.000us          40 b          40 b             1      [[10], [1, 10], [10, 10], [], []]
          aten::empty         0.19%       5.000us         0.19%       5.000us       5.000us           0 b           0 b             1               [[], [], [], [], [], []]
         aten::expand         4.22%     110.000us         4.45%     116.000us     116.000us           0 b           0 b             1                         [[10], [], []]
     aten::as_strided         0.23%       6.000us         0.23%       6.000us       6.000us           0 b           0 b             1                     [[10], [], [], []]
          aten::copy_         0.81%      21.000us         0.81%      21.000us      21.000us           0 b           0 b             1                 [[1, 10], [1, 10], []]
Self CPU time total: 2.605ms