Hello, I’m working on analyzing the bottlenecks in some training code. It’s a fairly complicated task: StyleGAN2-ADA training with distributed data-parallel training and quite a few other bells and whistles (the training code can be found here).
I’m wondering what the best way to approach profiling it is. I’ve noticed that in some cases, as training progresses, more memory is allocated. I don’t believe it’s a memory leak as sometimes things get deallocated, and I’ve never had it run out of memory even when running for more than a week.
I wasn’t too worried about it, but recently I’ve noticed that some runs don’t have these weird allocations and that those run tend to have a lower average tick duration (see graphs below). I have been tweaking some hyperparameter settings between runs, but I don’t understand how those hyperparameters could be affecting the amount of allocated memory (they’re just reweighting loss terms).


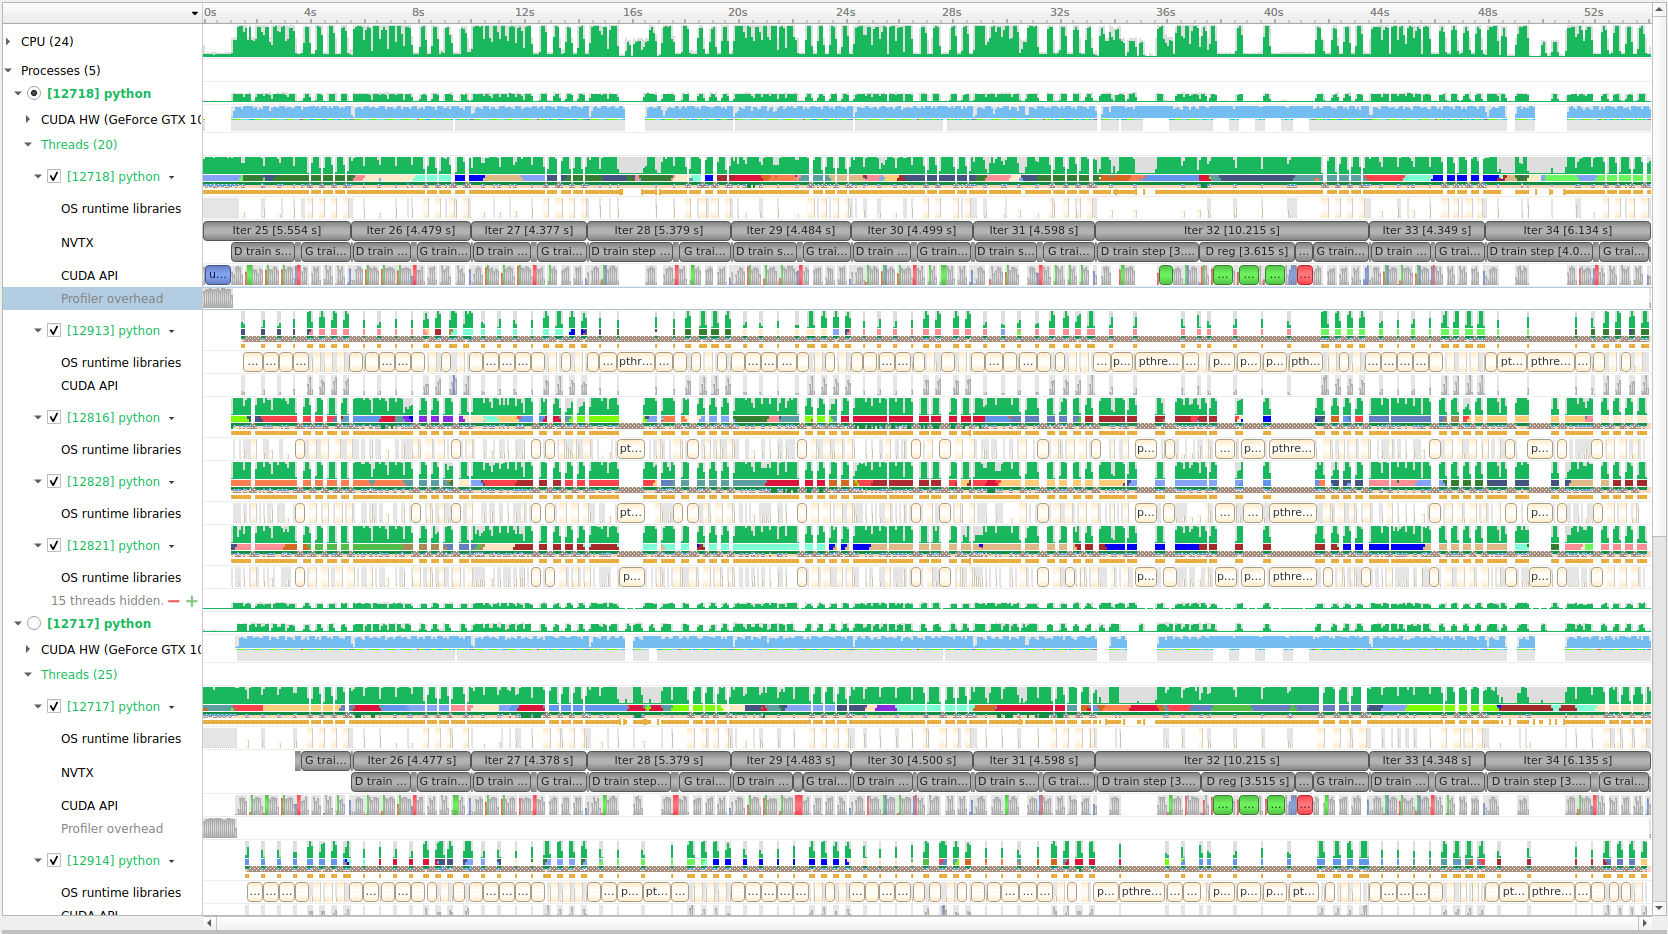
To try and understand what’s going on, first I added some torch.cuda.nvtx.ranges to the training code and profiled it with nsys (NVIDIA Nsight’s profiling CLI). I’m having a hard time interpreting the results and I don’t think it’s profiled the memory as I’m getting the error: unrecognised option '--cuda-memory-usage=true' despite the option being listed in the documentation.
(Here’s the trace for reference, maybe I’m just dumb and reading over useful information)
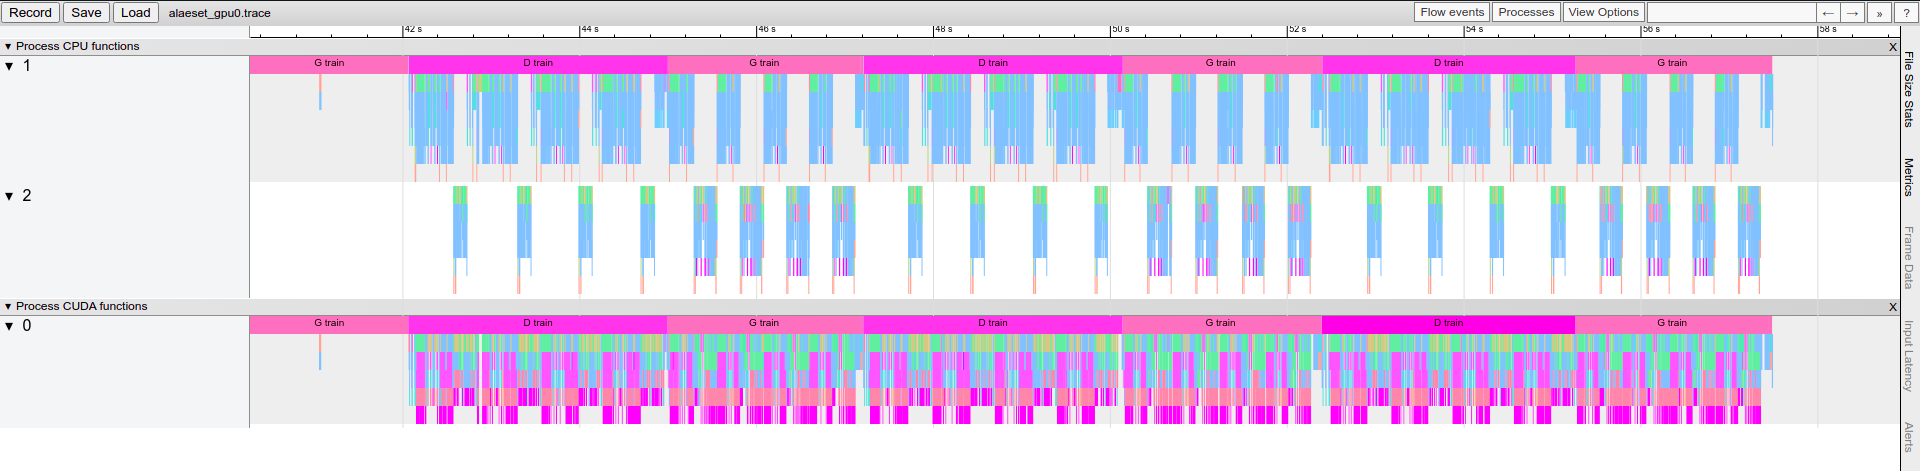
I’ve also tried using the autograd profiler, but am also having trouble interpreting the results to identify my problem. Is there an easy way to store the profiling object and analyze it later? Just printing out the tables and averages doesn’t seem to give me the allocation information over time as I want and the exported chrome trace doesn’t seem to have any memory information (despite profiling with use_cuda=True, record_shapes=True, profile_memory=True, and with_stack=True).

I’d love to hear any advice on how best to profile this issue or if there are any resources which go a bit deeper into using nsight, nvprof, or the autograd profiler to analyze memory usage. Thanks!