Hi, my program uses threading library to run some code in parallel to the main thread.
I am doing something that looks like :
(during backward pass)
t1 = threading.Thread(my_function_to_run_in_parallel)
t1.start()
(at the end of backward pass)
t1.join()
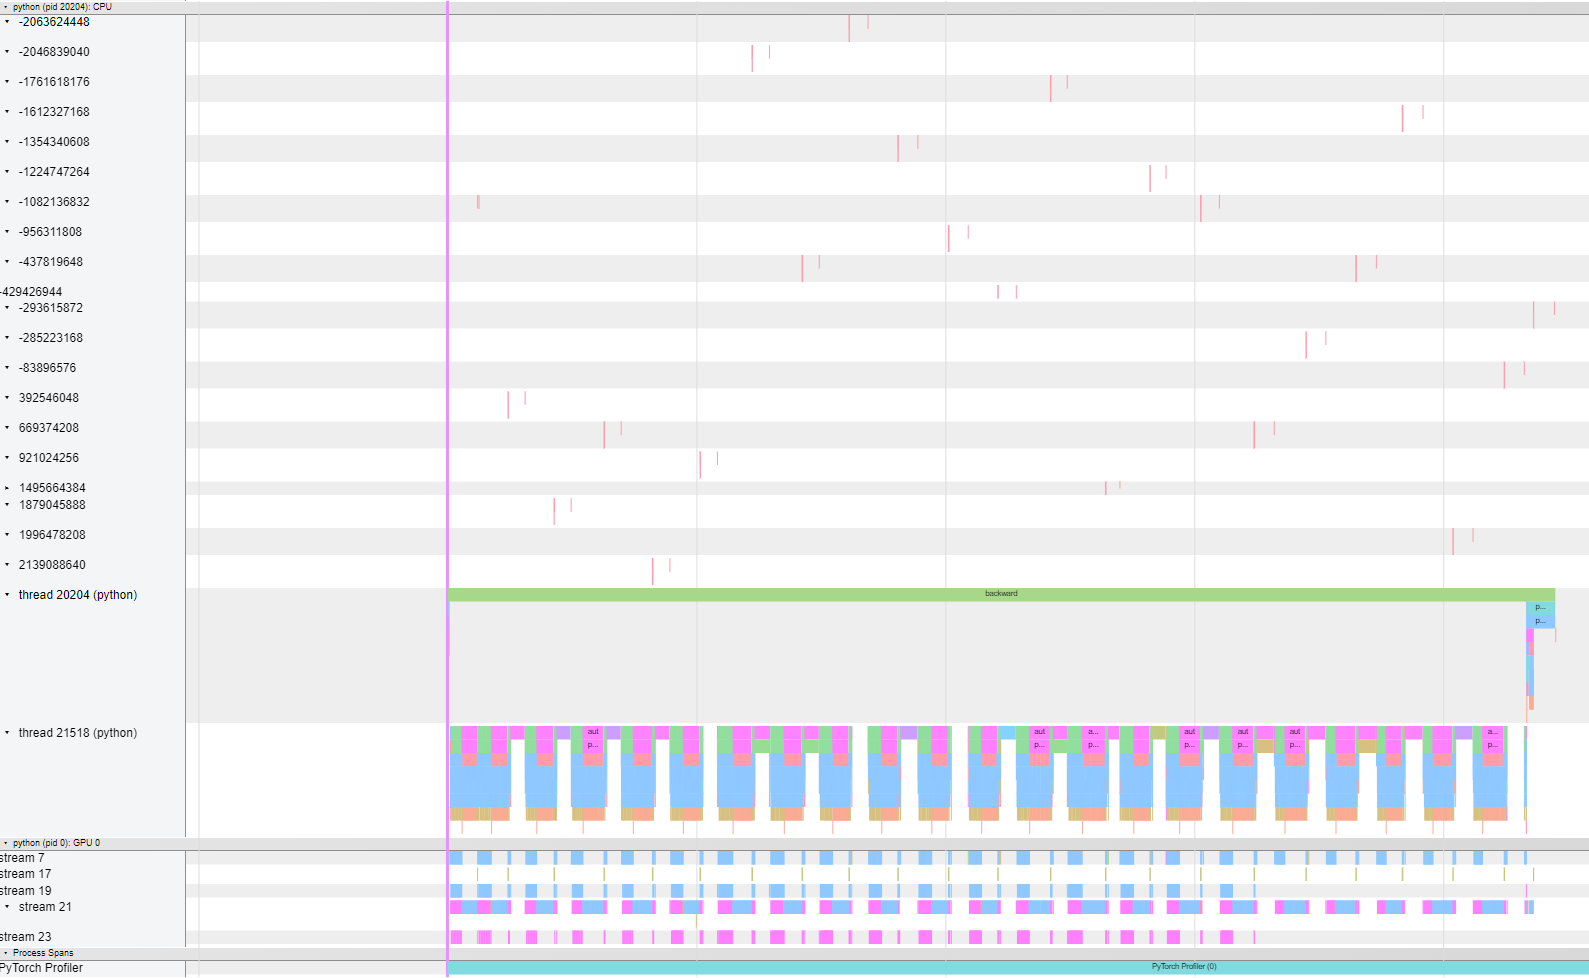
torch profiler shows the following result as trace
Is there any way to profile the contents of my_function_to_run_in_parallel?
Inserting record_functions inside this function creates segfaults ![]()