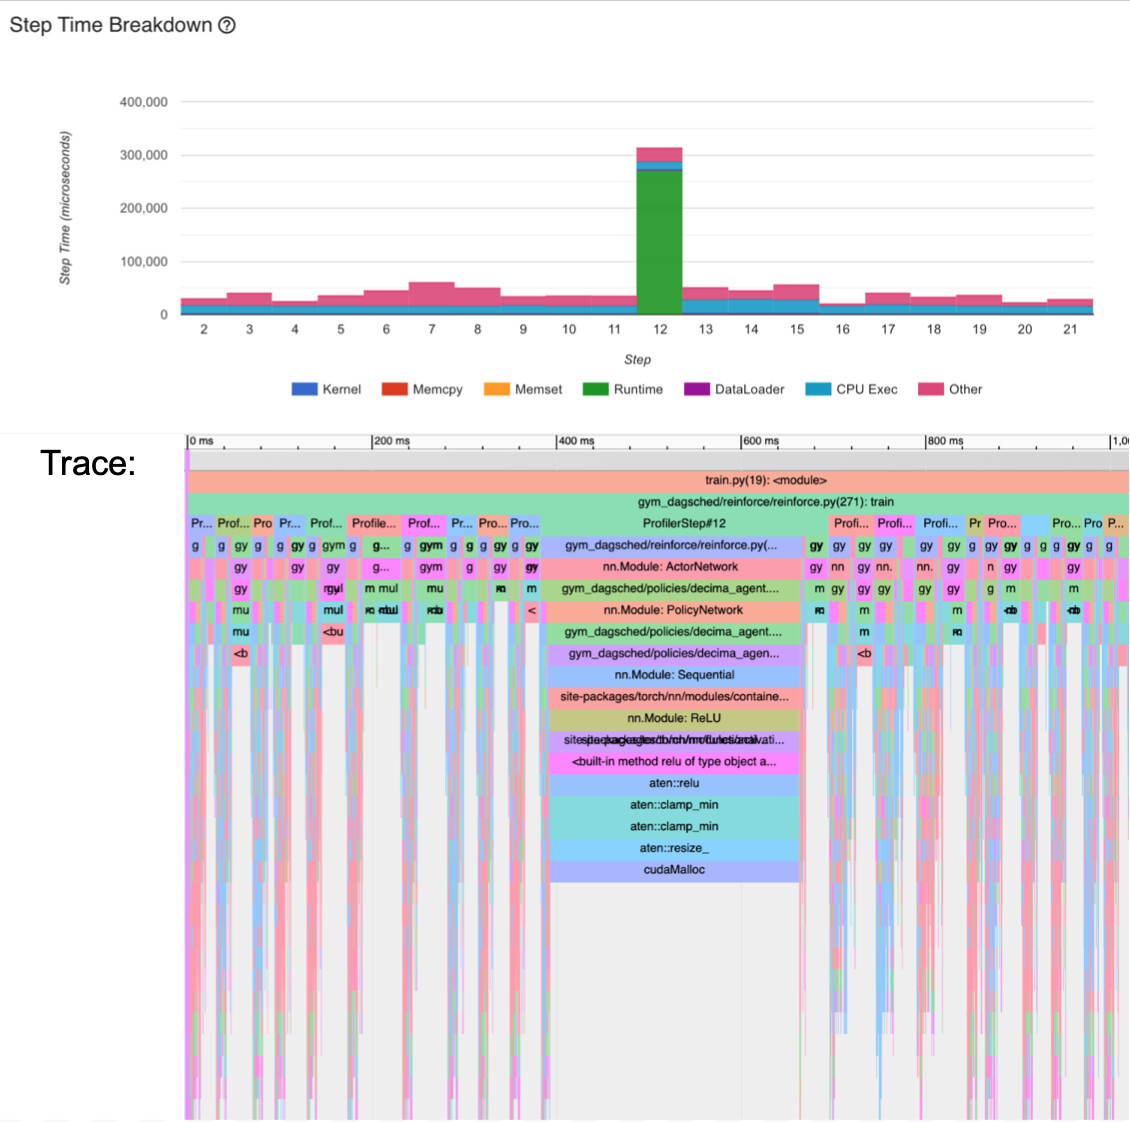
I am profiling my policy gradient RL code using Tensorboard. I call an agent at each step of an episode, and the observation’s batch dimension varies. Throughout the episode, the batch size gradually increases until it hits a peak, then decreases from then on. I notice that during some calls to the agent, there is an expensive call to cudaMalloc:
In step 12 of this this episode, the malloc occurs in atten::relu -> atten::clamp_min -> atten::resize_, which is often the case. I’ve also seen a slow cudaMalloc call come from atten::mul. The malloc calls alone account for 30-40% of my program’s runtime.
I thought that maybe this happens when the batch size increases significantly from the previous observation, but this is not the case. E.g. I saw two observations in a row with batch size 400, but only the second observation resulted in a cudaMalloc. Any other ideas on what could be going on? These occasional calls are bottlenecking my performance.
Edit: I’ve changed ReLU() to ReLU(inplace=True), so this no longer happens with relu. Now, I mostly see the malloc stem from repeat_interleave, cat, mm, mul, etc. This makes more sense, but I still wonder if there’s anything I can do to make the malloc faster. Maybe it has to do with memory fragmentation? I tried allocate a bunch of memory ahead of time instead of having these slow on-the-fly calls, but that didn’t help–the resize calls still take long.
cudaMalloc calls are synchronizing and expensive which is why PyTorch uses a caching allocator to reuse already allocated memory. In case you are clearing the cache via torch.cuda.empty_cache(), remove these calls. PyTorch does not allocate all available memory from the GPU and will allocate new memory if needed (e.g. if the memory in the cache cannot be reused), which is usually visible during a few initial warmup iterations.
Changing the input size might trigger this behavior and you might be able to avoid it by starting with the largest size of your input.
Hi @ptrblck, I appreciate your reply. Do you think that starting with the largest size of my input will result in less calls to cudaMalloc than initially allocating a large chunk of memory (e.g. 1 GB) like in this thread?
How exactly does the caching allocator reuse memory? If I have a call like t_repeat = torch.repeat_interleave(t, n, dim=0) in my forward method, then does the caching allocator try to reuse the same memory for the output of repeat_interleave each time? I.e. if the dimensions of t stay constant and n is largest on the very first call, then does each subsequent call necessarily reuse that same chunk of memory?
Yes, my suggestion was to use the largest size first to allocate enough memory which could be reused.
No, not necessarily since other tensors could reuse the cached memory before.
The caching allocator will move the memory of deleted tensors into its cache without freeing it via (expensive) cudaFree calls. If a new tensors needs to be allocated (e.g. as a result tensor from an operation), the caching allocator will try to reuse memory from the cache before trying to allocate new memory via cudaMalloc calls.
Okay, I understand your second answer. But can you please help me understand why reserving a very large chunk of memory ahead of time won’t work? E.g. if I do
t = torch.empty(num_bytes, dtype=torch.int8)
del t
then won’t num_bytes bytes of memory now be in the cache? So, as long as I am using less than num_bytes of memory at any given time, I can just reuse this memory without needing any more cudaMalloc calls. I know my logic is flawed somewhere, as I tried this and ended up with a bunch of “reserved” memory, but more memory kept being allocated nevertheless. Why isn’t the memory reusable?
Generally, your workflow should work as seen here:
import torch
from torch.profiler import profile, record_function, ProfilerActivity

# initial check
print(torch.cuda.memory_allocated() / 1024**2)
# 0.0
print(torch.cuda.memory_reserved() / 1024**2)
# 0.0

# allocate new memory
with profile(activities=[
        ProfilerActivity.CPU, ProfilerActivity.CUDA], record_shapes=True) as prof:
    with record_function("allocation"):
        x = torch.empty(1024**3, dtype=torch.uint8, device='cuda')
# note the cudaMalloc call!
print(prof.key_averages().table(sort_by="cuda_time_total", row_limit=10))
# -------------------------  ------------  ------------  ------------  ------------  ------------  ------------
#                      Name    Self CPU %      Self CPU   CPU total %     CPU total  CPU time avg    # of Calls
# -------------------------  ------------  ------------  ------------  ------------  ------------  ------------
#                allocation         0.44%     750.000us       100.00%     171.706ms     171.706ms             1
#               aten::empty         1.24%       2.127ms        99.56%     170.956ms     170.956ms             1
#     cudaStreamIsCapturing        97.67%     167.717ms        97.67%     167.717ms     167.717ms             1
#                cudaMalloc         0.65%       1.112ms         0.65%       1.112ms       1.112ms             1
#     cudaDeviceSynchronize         0.00%       5.000us         0.00%       5.000us       5.000us             1
# -------------------------  ------------  ------------  ------------  ------------  ------------  ------------
# Self CPU time total: 171.711ms

# Verify the memory is allocated and reserved
print(torch.cuda.memory_allocated() / 1024**2)
# 1024.0
print(torch.cuda.memory_reserved() / 1024**2)
# 1024.0

# delete x - the memory should still be reserved
del x
print(torch.cuda.memory_allocated() / 1024**2)
# 0.0
print(torch.cuda.memory_reserved() / 1024**2)
# 1024.0

# allocate the same tensor again
with profile(activities=[
        ProfilerActivity.CPU, ProfilerActivity.CUDA], record_shapes=True) as prof:
    with record_function("allocation"):
        x = torch.empty(1024**3, dtype=torch.uint8, device='cuda')

# no cudaMalloc calls!
print(prof.key_averages().table(sort_by="cuda_time_total", row_limit=10))
# -------------------------  ------------  ------------  ------------  ------------  ------------  ------------
#                      Name    Self CPU %      Self CPU   CPU total %     CPU total  CPU time avg    # of Calls
# -------------------------  ------------  ------------  ------------  ------------  ------------  ------------
#                allocation        62.10%     480.000us        98.71%     763.000us     763.000us             1
#               aten::empty        36.61%     283.000us        36.61%     283.000us     283.000us             1
#     cudaDeviceSynchronize         1.29%      10.000us         1.29%      10.000us      10.000us             1
# -------------------------  ------------  ------------  ------------  ------------  ------------  ------------
# Self CPU time total: 773.000us
As you can see no cudaMalloc call is visible and I can directly reuse the memory.
However, note that the cache is using a large and small segment size. Once your newly created tensor is too small the caching allocator will create a new pool for small segments and call into cudaMalloc again. Take a look at the Memory management section of the docs and also check torch.cuda.memory_stats() and torch.cuda.memory_snapshot() as debugging tools for your use case.
Thank you for your explanation! I read some more about the small and large allocators, and I have a better understanding now.
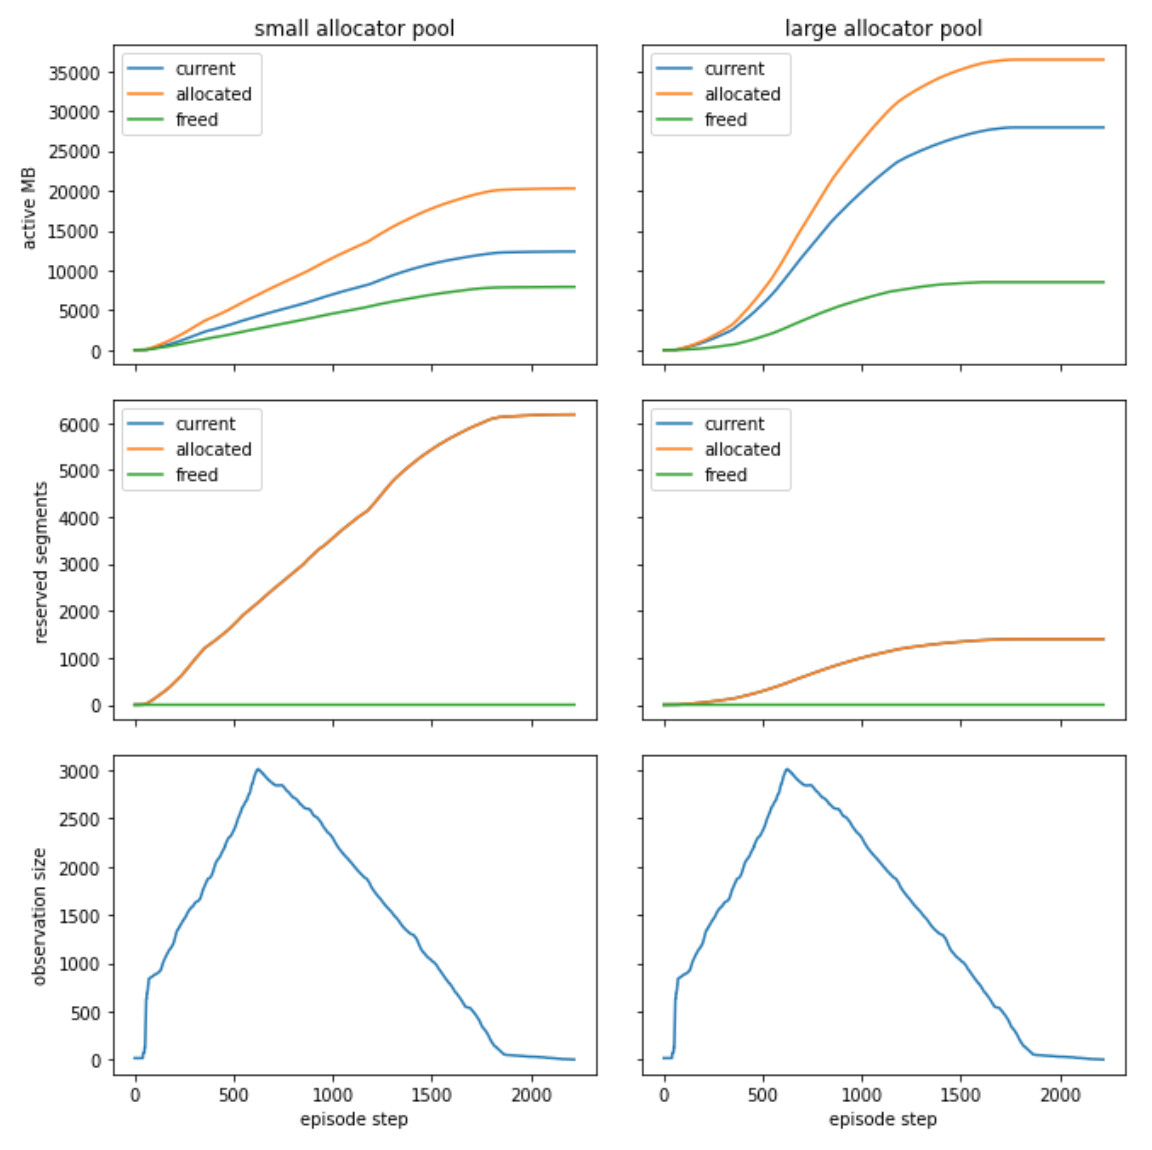
I tried doing a “warmup” episode, in which the environment makes a few observations of maximum size, but this didn’t help. I did some more profiling using torch.cuda.memory_stats(), and I have a suspicion that the computational graph is just massive and keeps on growing, which is why a few warmup iterations don’t really help:
Note that stats from the same episode are displayed in both columns; I’ve just split the stats by allocator type (small and large). I’m not sure if these plots reveal much, but it seems like memory that can be freed is getting freed. I believe the only memory that can’t be freed is the computation graph. Also, cudaMalloc reserves an increasing number segments as the episode progresses.
I’m pretty stuck right now and don’t know how to move forward. Can I profile the computational graph somehow? I’ll mention that I have a lot of computing power: A100 GPU with 80 GB RAM.