I am currently profiling my Torch implementation of a graphical model, using the python cProfile class. Inference on my model takes around 12 seconds on GPU (Torch), 15 seconds on CPU (Torch) and 14 using CPU (numpy). The very low speed-up from CPU to GPU surprised me and this is the reason I am profiling my model.
The profiling output (see below) indicates that 95% of the runtime is used by a single .cpu() call. This call is done at the very end of the prediction pipeline in order to copy the results into numpy.
| Torch Implementation | Numpy implementation |
|---|---|
| GPU: 12 seconds | CPU: 15 seconds |
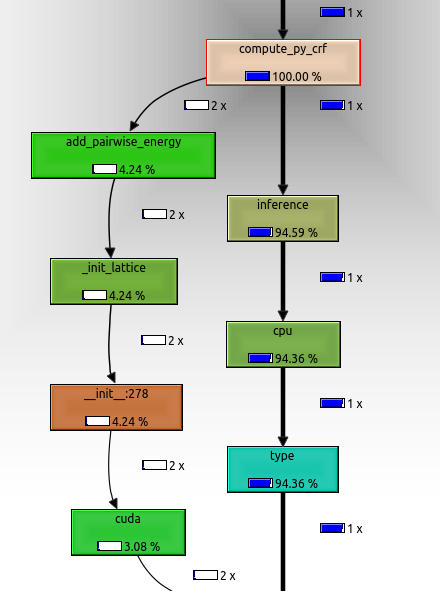
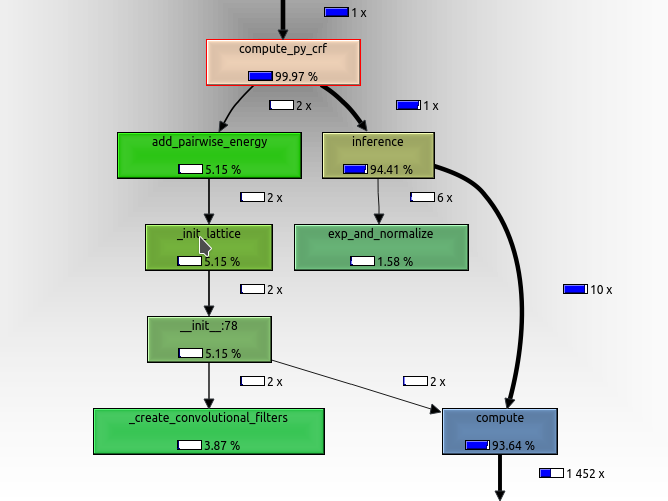
The main computation of the model is done in the kernel.compute() function, which is called 10 times (see pseudo-code below). In the numpy implementation this takes up about 93% of the runtime, which seams about right. kernel.compute() mainly consists of convolutions, dot-products, matrix-multiplications, reshapes and transposes. Surprisingly, the kernel.compute() call does not even show up in the torch profile graph. This means that less then 1% of computational time is spend inside this function.
PseudoCode
def inference(self, num_iter=10):
    # Essentially softmax
    prediction = exp_and_normalize(-self.unary)
    for i in range(num_iter):
        tmp1 = -self.unary

        # Main computational effort
        tmp2 = self.kernel.compute(prediction)

        tmp1 = tmp1 - tmp2
        prediction = exp_and_normalize(tmp1)

    return prediction.cpu().data.numpy()
So overall I am very surprised by this finding and I wonder how to interpret this. At the moment I see three possibilities:
-
The single
cpu()call indeed takes around 11 seconds. Maybe this is do to a bug? In this case I wonder how I would like to know how I can work around this. Maybe doing the data copying in parallel? Also do you know how I can test whether this hypothesis is true? -
Pytorch does all the gpu processing in parallel. The rest of the code only lines up computations for the GPU. The
cpu()call then essentially is a join operation making the python interpreter wait till all the gpu computations are finished. Can somebody confirm this? If this is true, is there a way for me to profile my implementation? -
There are a view hidden
.cpu()calls I (and the profiler) don’t know about. I am creating a view torch variables insideself.kernel.compute(prediction). Maybe this is where the computation time goes?