So there are several things here:
- At some point the pipeline for CUDA is full so new things wait for old things to be done when they want to be queued. Or you have a sync naturally (printing the loss, save weights, …), so for example the time per epoch will likely be reasonably accurate for large enough datasets without any additional measures.
- The flip side of asynchronous CUDA is that if dataloading can be done (in part) while the GPU computes with the previous batch, it that time would not hurt overall performance. So if you manage to saturate the GPU, you likely don’t have a dataloading perf issue.
Because I like undercomplex measurements a lot, I sometimes just do the following in a separate process (probably only works for one GPU, but you get the idea):
utilizaton = []
for i in range(100):
    utilizaton.append(float(subprocess.run(['nvidia-smi', '--query-gpu=utilization.gpu', '--format=csv,noheader'], capture_output=True).stdout.decode().strip().replace(' %','')))
    time.sleep(0.05)
pyplot.plot(utilizaton)
For a recent run of finetuning something, that looked like this for me, and I thought it was very reasonable:
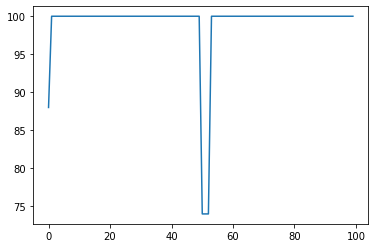
If you find this to be 0 more often than not while your training runs, you’re in trouble.
In this case, I would probably just sprinkle time.perf_counter() accounting onto the training loop. The important bit here is to include the time that elapses between the end of the loop and the start of the next iteration, as this is the time the program is waiting on the next batch, i.e.
   time_dl = 0
   time_loop = 0
   t0 = time.perf_counter()
   for i, (img, lab) in enumerate(dl):   # the implicit `img, lab = next(dl)` here is where dataloading time is spent
      t1 = time.perf_counter()
      time_dl += t1 - t0
      t0 = t1
      ... # do the usual things here
      # optionally torch.cuda.synchronize() here
      t1 = time.perf_counter()
      time_loop += t1 - t0
      t0 = t1
This should give you an idea of whether the dataloading or the loop is where the program spends the most time. If you uncomment the synchronization, PyTorch will enforce no overlap from queued but unfinished CUDA computation. The difference between the loop measurements with and without is approximately the overlap (i.e. harmlessly spent dataloading time).
Of course, the same should work with cprofile / py-spy instead of manually doing this.
Of course, a more sophisticated method is to use with torch.profiler.profile(): and the corresponding analysis tools.
Best regards
Thomas
