Is there a way to record what happens in a thread triggered inside the profile block ?
For instance
import threading
import time

import torch
from torch.profiler import record_function


def worker():
    for _ in range(20):
        with record_function("worker_random"):
            torch.rand(2048, 2048)
            time.sleep(0.05)


with torch.profiler.profile(activities=[torch.profiler.ProfilerActivity.CPU]) as p:
    t = threading.Thread(target=worker)
    t.start()
    for _ in range(10):
        with record_function("main_thread_empty"):
            torch.empty(1024, 1024)
            time.sleep(0.1)
    t.join()
p.export_chrome_trace("trace.json")
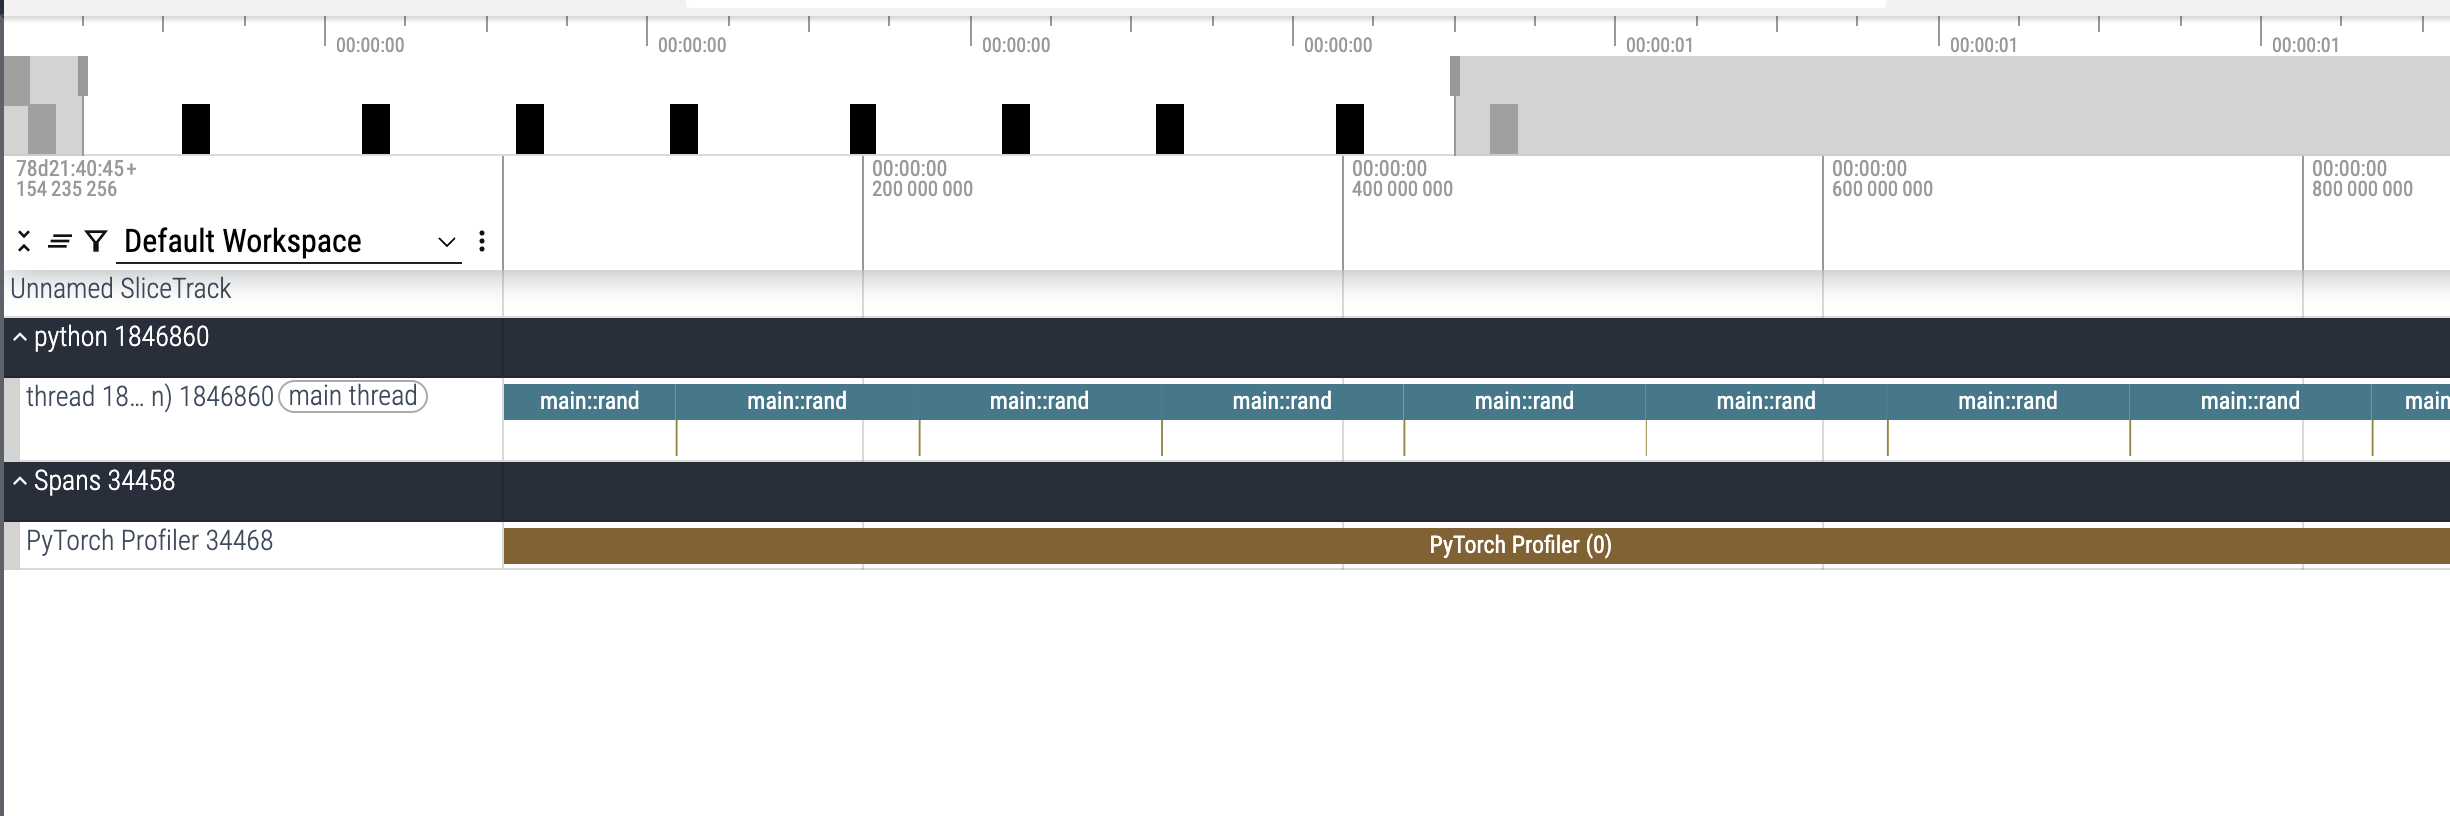
In the trace I only see the “main_thread_empty” and the profiler as seen in the following screenshot:
“If multiple profiler ranges are active at the same time (e.g. in parallel PyTorch threads), each profiling context manager tracks only the operators of its corresponding range.”
I found this here, which seems to indicate that it may not be possible? I suppose one workaround would be to create a second profiler in the thread and open the trace in two tabs for comparison.
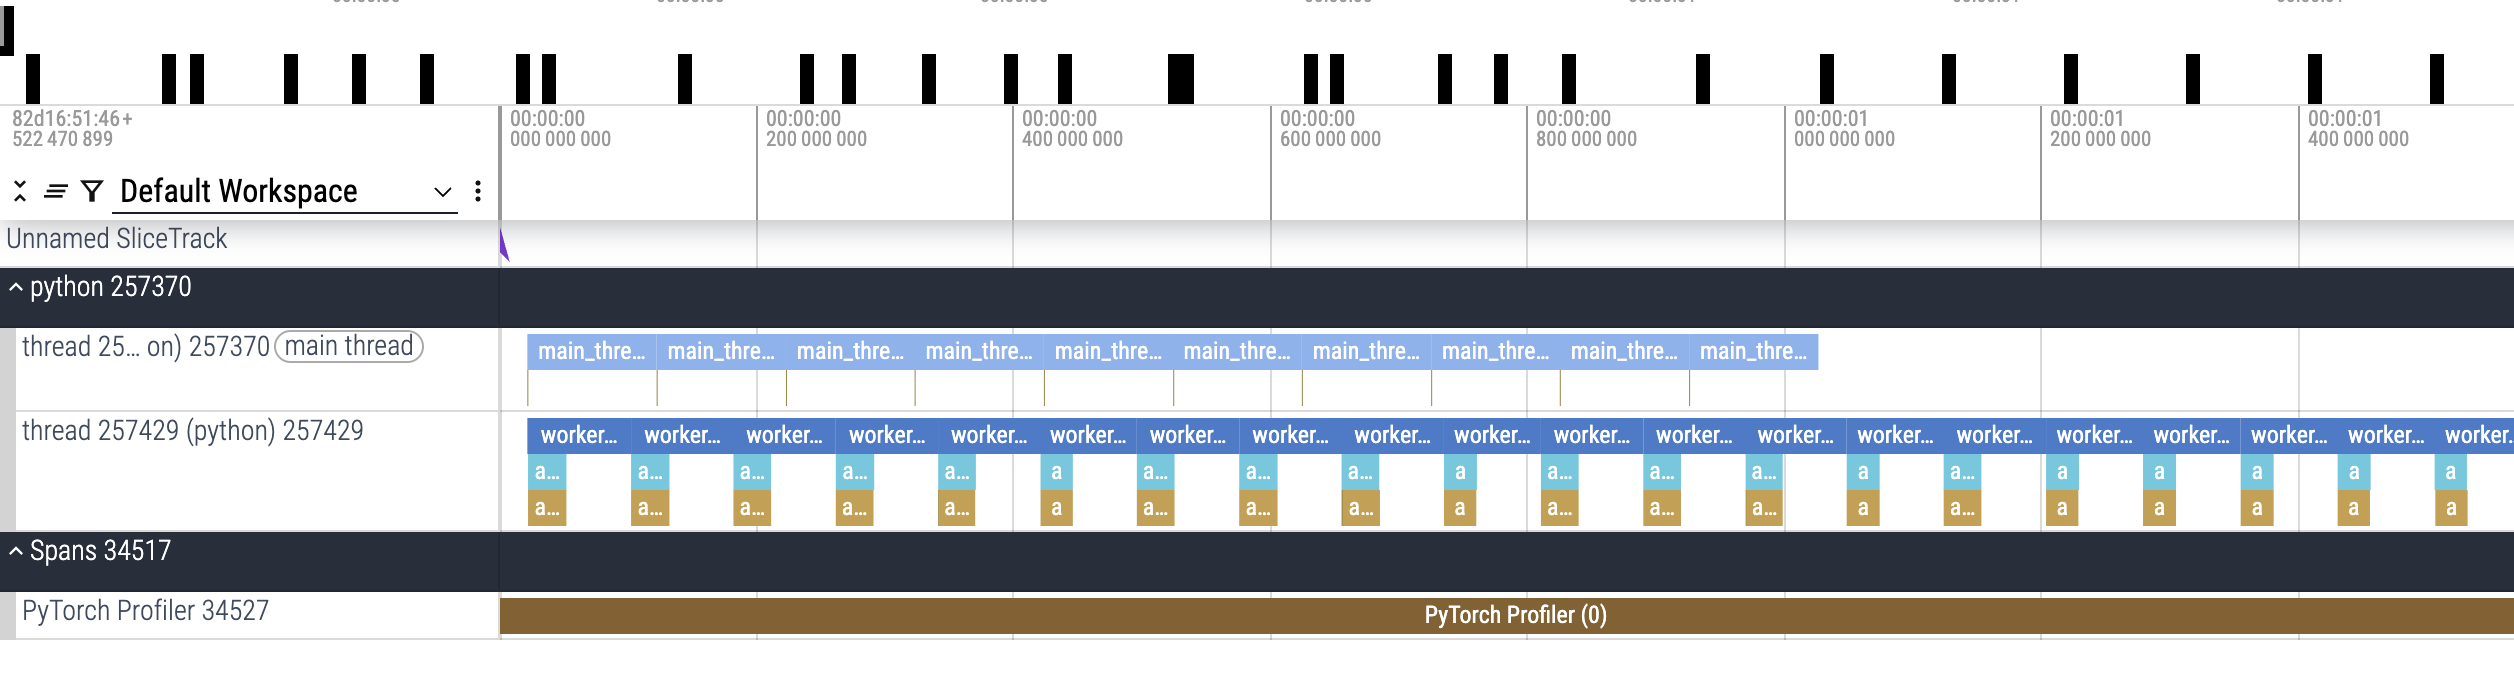
Actually found the “profile_all_threads” option that can be added, it works well this this, at least for this simple scenario:
import threading
import time

import torch
from torch.profiler import _ExperimentalConfig, record_function

if __name__ == "__main__":

    def worker():
        for _ in range(20):
            with record_function("worker_random"):
                torch.rand(2048, 2048)
                time.sleep(0.05)

    with torch.profiler.profile(
        activities=[torch.profiler.ProfilerActivity.CPU],
        experimental_config=_ExperimentalConfig(profile_all_threads=True),
    ) as p:
        t = threading.Thread(target=worker)
        t.start()
        for _ in range(10):
            with record_function("main_thread_empty"):
                torch.empty(1024, 1024)

                time.sleep(0.1)
        t.join()
    p.export_chrome_trace("trace.json")
Will give