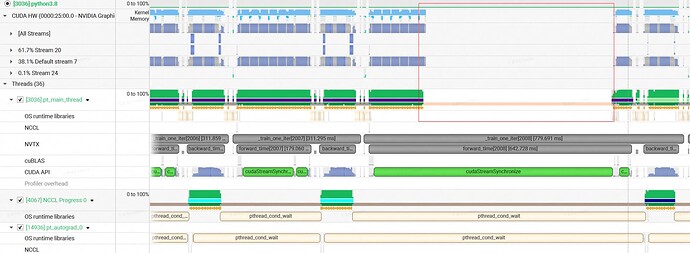
Hello everyone, after expanding our training data scale, we noticed a significant increase in the time per iteration. Using the nsys profiler, we found that after loading a large dataset into memory for training, the main training thread would randomly get stuck. You can see the situation in the image below.
- Initially, we suspected it was a communication issue, as most of the cards were stuck on NCCL communication operators.
- After careful investigation, we discovered that the cause of the NCCL slowdown was due to some GPUs’
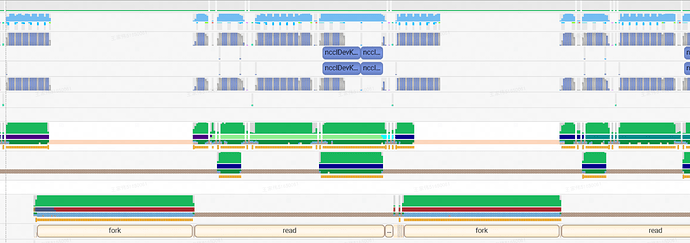
pt_main_threadbeing in an unscheduled state during the iterations where the time increased. This caused an increase in the time taken for the forward phase. Meanwhile, the other GPUs, which were functioning normally, experienced NCCL slowdown because they had to wait for the GPUs corresponding to the stuckpt_main_thread.
- We found that in most cases, the stuck state of the
pt_main_threaddepended on another thread that was being forked. Generally, once the other thread finished forking, the stuckpt_main_threadwould resume scheduling.
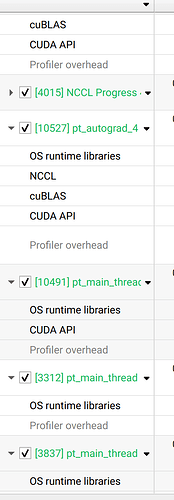
- From the perspective of the nsys profiler, we could only see multiple threads under python3.8, and there were many threads with the same name as “pt_main_thread.” We couldn’t gain any information from the thread names. Additionally, the call stacks of each thread did not provide much valuable information.
This phenomenon did not occur when we used smaller datasets or fewer GPUs for training. This issue is quite peculiar, and we haven’t encountered it before. We would like to ask if anyone has experienced similar bugs or if there are any suggestions on how to approach analyzing this problem more effectively?
We would like to ask for advice on how to further debug this issue and identify the root cause.


