I was profiling my code and noticed a list comprehension taking a long time. The list comprehension was in the following method:
    def get_targets(self, next_states):
        next_states = torch.stack([next_states[:, i, :].unsqueeze(dim=0).repeat(self.ensemble_size, 1, 1) for i in range(self.ensemble_size)])
        with torch.no_grad():
            targets_ = self.critic_target.batched_forward_(next_states).max(dim=-1)[0].mean(dim=-1)
            idx = [torch.randperm(self.ensemble_size)[:2] for _ in range(self.ensemble_size)]
            targets = torch.cat([targets_[i][:, idx[i]].min(dim=-1, keepdim=True)[0] for i in range(self.ensemble_size)], dim=1)
        return targets
the list comprehension in question is the line which assigns the targets variable. So, I thought I would try and make this quicker by using the following:
    def get_targets(self, next_states):
        next_states = torch.stack([next_states[:, i, :].unsqueeze(dim=0).repeat(self.ensemble_size, 1, 1) for i in range(self.ensemble_size)])
        with torch.no_grad():
            targets_ = self.critic_target.batched_forward_(next_states).max(dim=-1)[0].mean(dim=-1)
            idx = torch.stack([torch.randperm(self.ensemble_size)[:2] for _ in range(self.ensemble_size)]).to(self.device)
            targets = targets_.gather(-1, idx.unsqueeze(dim=1).repeat(1, self.batch_size, 1)).min(dim=-1)[0].transpose(0, 1)
        return targets
Now, after profiling, the overall time is slightly faster but there is still a huge bottleneck in putting the idx tensor onto the GPU, and this method is called at the same frequency as the get_targets method. What is most confusing is that I put much larger tensors onto the GPU in other parts of the file and they are much quicker. Does anybody know what could be causing this?
For reproducibility, next_states is a tensor of sizes (512, 25, 9), replace the line targets_ = self.critic_target.batched_forward_(next_states).max(dim=-1)[0].mean(dim=-1) with targets_ = torch.randn((25, 512, 25)), and self.ensemble_size and self.batch_size are 25 and 512, respectively.
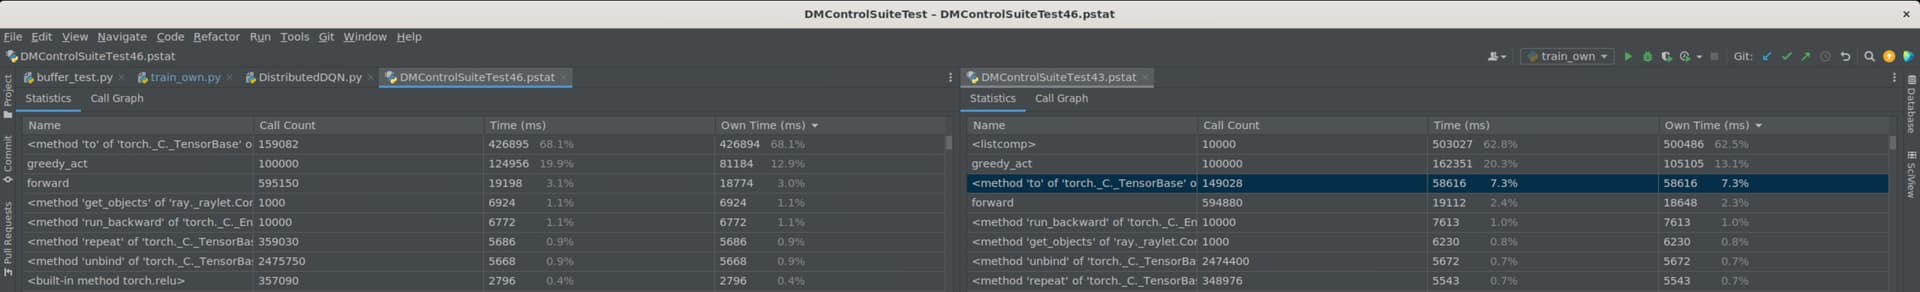
Below, I will also add a snapshot of the profiling results to demonstrate how the .to() method starts to be dominated by this single line. The LHS is the code after making the change. We can see that we get rid of the list comprehension that was dominating the time, but with only 10k more calls to the .to() method (which checks out with how many times the above method was called during profiling) we are now almost 10x slower. As I mentioned previously, I don’t know why this would be the case since I put much larger tensors on the GPU using this code:
    def get_batch(self):
        batch = self.memory.sample()
        states, actions, rewards, next_states, dones = batch
        states = states.view(self.batch_size, self.ensemble_size, -1).to(self.device)
        actions = actions.view(self.batch_size, self.ensemble_size, -1).to(self.device)
        rewards = rewards.view(self.batch_size, self.ensemble_size).to(self.device)
        next_states = next_states.view(self.batch_size, self.ensemble_size, -1).to(self.device)
        dones = dones.view(self.batch_size, self.ensemble_size).to(self.device)

        return states, actions, rewards, next_states, dones
where we can assume that the dimensions are much larger than the small idx tensor. In case it is relevant, states, next_states, rewards are all float tensors whilst dones and actions are long tensors.