I am trying to use neural network to fit the boston housing dataset, as a starting point, I want to firstly overfit the training data. This seems to be a trivial task, the below code is used
from sklearn.datasets import load_boston
from sklearn.model_selection import train_test_split
from sklearn.neural_network import MLPRegressor
import numpy as np
import sklearn
import matplotlib.pyplot as plt
import torch
import torch.nn as nn
boston = load_boston()
X,y = (boston.data, boston.target)
dim = X.shape[1]
X_train, X_test, y_train, y_test = train_test_split(X, y, test_size=0.1, random_state=0)
num_train = X_train.shape[0]
torch.set_default_dtype(torch.float64)
net = nn.Sequential(
nn.Linear(dim, 50, bias = True), nn.ReLU(),
nn.Linear(50, 50, bias = True), nn.ReLU(),
nn.Linear(50, 50, bias = True), nn.ReLU(),
nn.Linear(50, 1)
)
criterion = nn.MSELoss()
opt = torch.optim.Adam(net.parameters(), lr = 1e-6)
num_epochs = 1000
from torch.utils.data import TensorDataset, DataLoader
dataset = TensorDataset(torch.from_numpy(X_train).clone(), torch.from_numpy(y_train).clone())
loader = DataLoader(dataset=dataset, batch_size=128, shuffle=True)
for i in range(num_epochs):
for x,y in loader:
loss = criterion(y, net(x))
loss.backward()
opt.step()
if i > 0 and i % 100 == 0:
print('Epoch %d, loss = %g' % (i, loss))
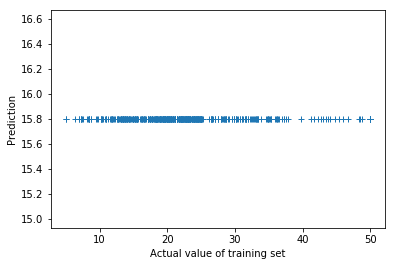
py = net(torch.DoubleTensor(X_train))
plt.plot(y_train, py.detach().numpy(), '+')
plt.xlabel('Actual value of training set')
plt.ylabel('Prediction')
However, the trained model completely underfits the data, the below figure is drawn:
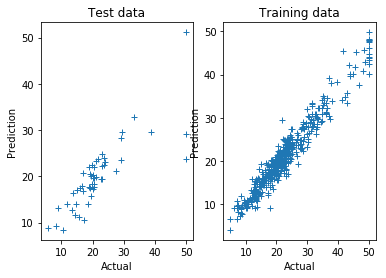
This seems to indicate some bugs in my code instead of low model capacity, I also tried the MLPRegressor in sklearn using the very same architecture, optimizer and hyperparameters:
model = MLPRegressor(
    hidden_layer_sizes=(50,50,50),
    alpha = 0,
    activation='relu',
    batch_size=128,
    learning_rate_init = 1e-3,
    solver = 'adam',
    learning_rate = 'constant',
    verbose = False,
    n_iter_no_change = 1000,
    validation_fraction = 0.0,
    max_iter=1000)
model.fit(X_train, y_train)

py = model.predict(X_test)
err = y_test - py
mse = np.mean(err**2)
rmse = np.sqrt(mse)
print('rmse for test %g' % rmse)
plt.subplot(121)
plt.plot(y_test, py, '+')

err = y_train - model.predict(X_train)
mse = np.mean(err**2)
print('rmse for train: %g' % np.sqrt(mse))
plt.subplot(122)
plt.plot(y_train, model.predict(X_train), '+')
The sklearn code gives reasonable predictions, as shown below: