Hi, I would like to ask some questions about how graphs are computed.
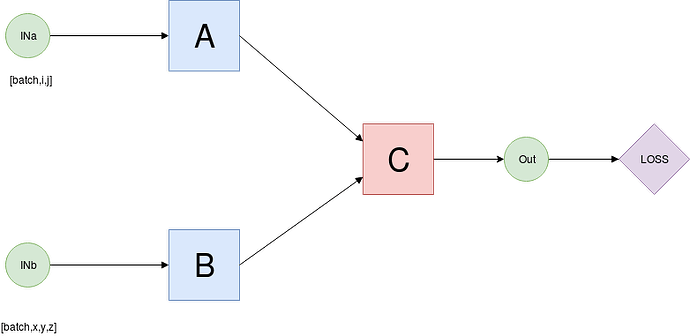
Imagine a simple multimodal model where we have 3 sub-networks, A,B,C.
INa and INb are torch variables, with whatever dimensionality but the dimension corresponding to the batch is dim 0, and both have the same amount of samples.
If the proper workflow for one sample were:
A process a sample of INa and B process a sample of INb, then C takes as input OUTa and OUTb to compute OUT.
and so on through the whole batch. When the batch is already processed compute loss and backprop
Is the previously mentioned graph equal to a graph generated by the following process?:
A process the whole batch INa, B process the whole batch INb, then C process the the whole batch OUTa, OUTb and loss-backward?
in pseudo-code:
for i in range(batch_size):
     outa_i = model_A(INa_i)
     outb_i = model_B(INb_i)
     out_i = model_C(outa_i,outb_i)s
stack(out)
loss
backward
for i in range(batch_size):
     outa_i = model_A(INa_i)
outa=stack(outa_i)
for i in range(batch_size):
     outb_i = model_B(INb_i)
outb=stack(outb_i)
for i in range(batch_size):
     out_i = model_C(outa,outb)
out=stack(out_i)

loss
backward
Is there a good explanation about pytorch graphs?


