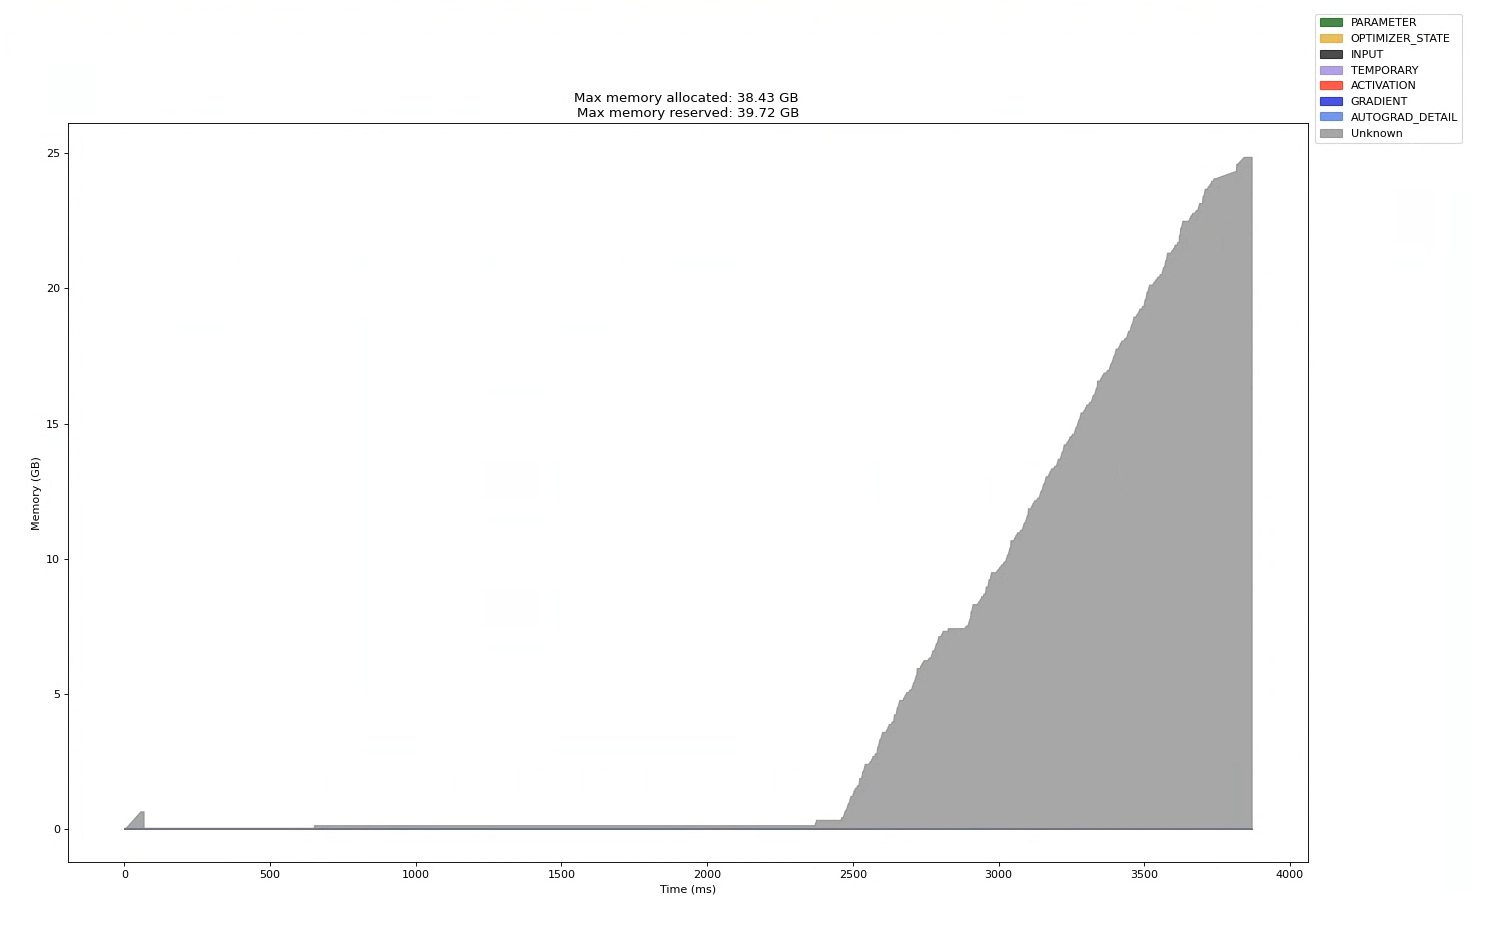
I’m trying to use PyTorch’s memory timeline generated by the profiler to visualize what is contributing to a GPU OOM problem. The memory allocation ramp shown in the attached image is happening during the first forward pass of a 13B parameter Llama2 model. I don’t understand why the memory allocations are categorized as “unknown” instead of using the other categories shown in the legend (e.g., parameters, activations, etc).
One piece of info that may or may not be relevant: I’m using DeepSpeed Zero-3 on a 16-GPU cluster. Is it possible that DeepSpeed isn’t playing well with the profiler’s ability to recognize the memory allocation categories?
Here’s my code…
def TrainSampleBasedDataParallel(gargs, clargs):
    # Create and initialize model
    model = CreateAndInitializeLlama2Model(gargs)
    DS.runtime.zero.stage3.estimate_zero3_model_states_mem_needs_all_live(model, num_gpus_per_node=16, num_nodes=1)

    modelLayers = model.AsPipelineLayers()

    modelWithObjectives = ModelWithObjectives(modelLayers)
    DS.zero.Init(module=modelWithObjectives)

    modelEngine, _, _, _ = DS.initialize(config=gargs.DEEPSPEED_CONFIG,
                                            model=modelWithObjectives,
                                            model_parameters=modelWithObjectives.parameters()
                                        )


    # Create Dataloaders
    trainDataLoader, evalDataLoader = CreateDataLoaders(gargs)

    import logging
    import socket
    from datetime import datetime, timedelta

    from torch.autograd.profiler import record_function
    from torchvision import models

    logging.basicConfig(
    format="%(levelname)s:%(asctime)s %(message)s",
    level=logging.INFO,
    datefmt="%Y-%m-%d %H:%M:%S",
    )
    logger: logging.Logger = logging.getLogger(__name__)
    logger.setLevel(level=logging.INFO)

    TIME_FORMAT_STR: str = "%b_%d_%H_%M_%S"

    def trace_handler(prof: PT.profiler.profile):
        # Prefix for file names.
        host_name = socket.gethostname()
        timestamp = datetime.now().strftime(TIME_FORMAT_STR)
        file_prefix = f"{host_name}_{timestamp}_gpu{gargs.DEVICE_ID}"

        # Construct the trace file.
        prof.export_chrome_trace(f"{file_prefix}.json.gz")

        # Construct the memory timeline file.
        prof.export_memory_timeline(f"{file_prefix}.html", device=gargs.DEVICE)

    with PT.profiler.profile(
        activities=[
            PT.profiler.ProfilerActivity.CPU,
            PT.profiler.ProfilerActivity.CUDA,
        ],
        schedule=PT.profiler.schedule(wait=0, warmup=0, active=6, repeat=1),
        record_shapes=True,
        profile_memory=True,
        with_stack=True,
        on_trace_ready=trace_handler,
    ) as prof:
        # ================
        # Training loop
        # ================
        modelEngine.zero_grad()
        for trainBatch in trainDataLoader:
            prof.step()
            with record_function("## forward ##"):
                trainBatchOnDevice = SendTupleOfTupleTensorsToDevice(trainBatch, gargs.DEVICE)
                trainLoss, output = modelEngine(trainBatchOnDevice)
            with record_function("## backward ##"):
                modelEngine.backward(trainLoss)
            with record_function("## optimizer ##"):
                modelEngine.step()
                modelEngine.zero_grad()